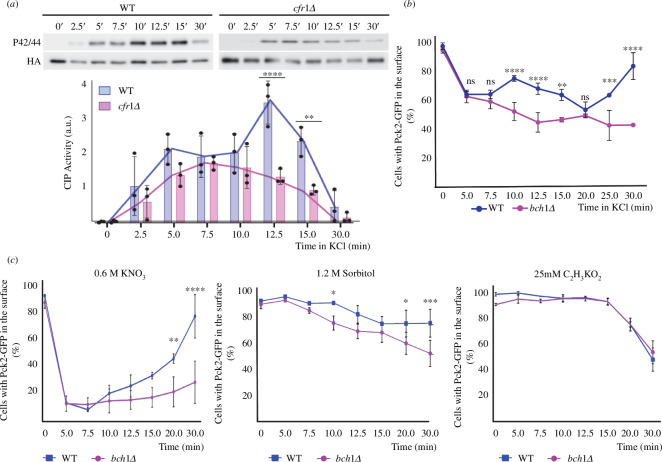
Figure 4.
Inefficient cell integrity pathway ( CIP ) activation correlates with defects in the localization of Pck2. ( a ) Cells from the wild-type control (WT) and the exomer mutant cfr1Δ were exposed to 0.6 M of KCl for the indicated times (minutes). CIP activation was analysed in purified Pmk1-HA:6His samples by western blot using anti-p42/44 (phosphorylated Pmk1) and anti-HA (total Pmk1) antibodies. The bar graphs depicted below the blots represent the CIP activity, calculated as the ratio between the p42/44 (phosphorylated Pmk1) and HA (total Pmk1) signals. They show the mean and standard deviation. a.u., arbitrary units. Line graphs for the same values have been depicted to facilitate the comparison of the CIP activation dynamics in both strains. ( b ) Percentage of cells incubated in YES with 0.6 M of KCl for the indicated times that exhibited Pck2-GFP at the cell poles and cell sides, but not in the cell equator and septa ( Materials and methods). ( c ) The same as in ( b ), but the cells were exposed to 0.6 M of KNO3 (left panel), 1.2 M of sorbitol (central panel) or 25 mM of C2H3KO2 (right panel). The Šidák correction was used after ANOVA to determine the statistical significance of the difference between the value for the WT and the mutant strains treated for the same time. ns, non-significant; * p < 0.05¸** p < 0.01; *** p < 0.001; **** p < 0.0001.

