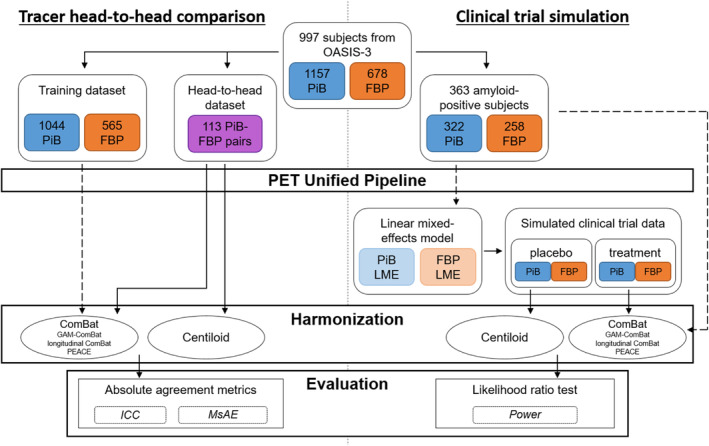
FIGURE 1.

Flowchart of data for the tracer head‐to‐head comparison (left) and clinical trial simulation (right). Dotted arrows indicate where data was used to train ComBat or linear mixed effects models.

Flowchart of data for the tracer head‐to‐head comparison (left) and clinical trial simulation (right). Dotted arrows indicate where data was used to train ComBat or linear mixed effects models.