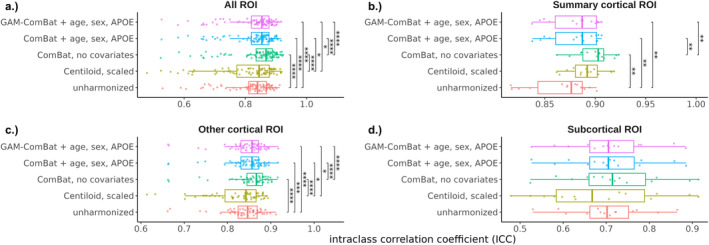
FIGURE 3.

Distribution of regional ICC across all ROIs, grouped by harmonization method and ROI subgroup. Each point represents a single ROI. Significance levels from paired t‐tests with Bonferroni correction are indicated for each pair of harmonization methods (*p < 0.05, **p < 0.01, ***p < 0.005, ****p < 1e‐4).
