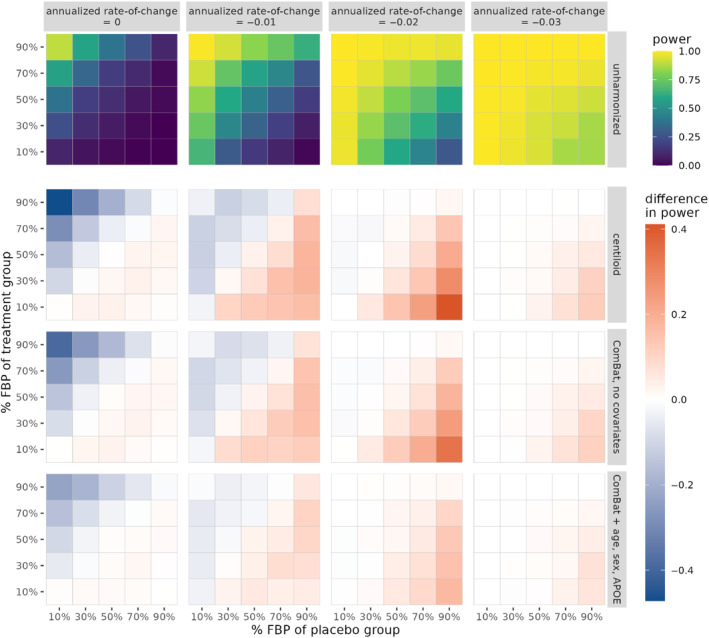
FIGURE 6.

Statistical power of detecting group differences in rate‐of‐change of the global summary SUVR between treatment and placebo groups, computed as the proportion of significant findings over 1000 iterations. Power is plotted for unharmonized SUVR, while the difference in power relative to unharmonized is plotted for all harmonization methods. The true underlying rate‐of‐change is varied across columns. The proportion of FBP scans in the placebo and treatment groups is varied across the horizontal and vertical axes of each heatmap, respectively. Note that for annualized rate‐of‐change equal to zero, the proportion of significant findings corresponds to Type‐I error rate.
