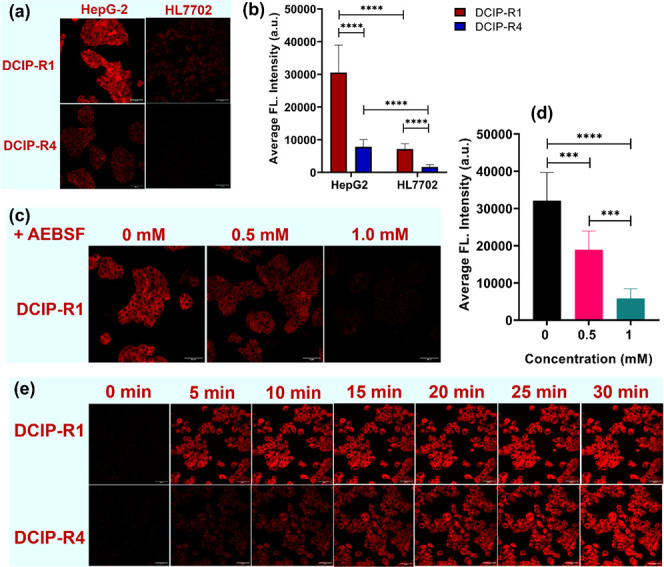
Figure 2.

Two-photon fluorescence imaging of esterase in liver cancer cells by DCIP-R probes. (a) Representative fluorescence images of HepG2 or HL7702 cells, which were incubated with DCIP-R1 or -R4 for 10 min, respectively; (b) quantification of the average fluorescence intensity obtained from (a); (c) representative fluorescence images of HepG2 pretreated with AEBSF at various concentrations (0, 0.5, and 1 mM) for 30 min before staining with DCIP-R1; (d) quantification of average fluorescence intensity obtained from (c); (e) fluorescence images of HepG2 cells stained with 1 μM of DCIP-R1 (upper panel) and -R4 (lower panel) from 0 to 30 min at 37 °C. Cell imaging was performed by two-photon microscopy: λex = 960 nm, λem = 604–678 nm for the red channel. Scale bars: 50 μm. Data are presented as mean ± SD. Significant differences were analyzed using the Kruskal–Wallis test with the Dunn’s multiple comparison test. ****p < 0.0001.
