
Figure 3.
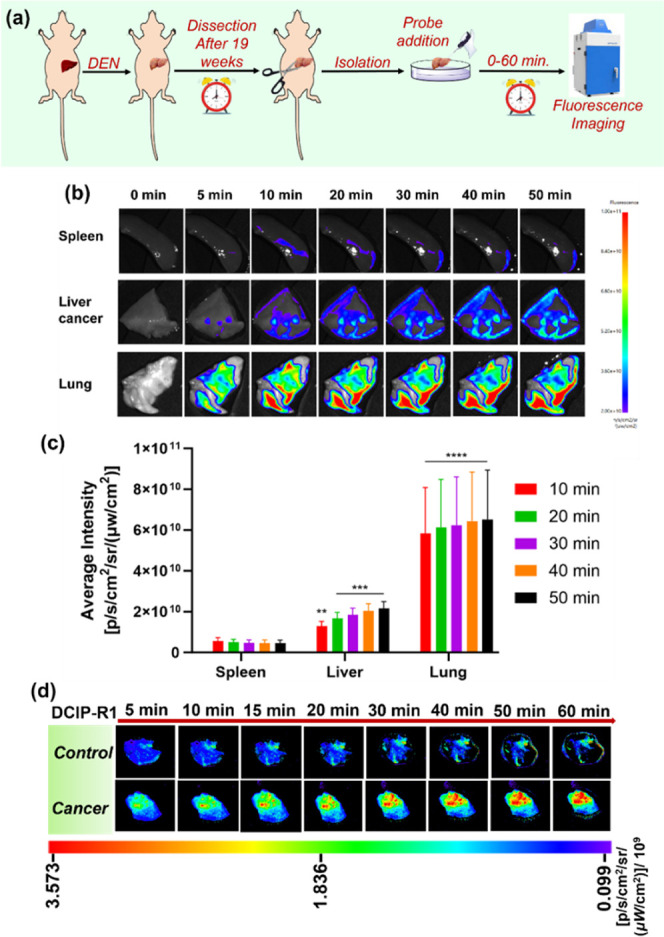
Time-dependent fluorescence imaging of DEN-induced rat liver tumor model dissected after 19 weeks. (a) The procedure for evaluating the functionality of probes in detecting liver cancers; (b) fluorescence imaging of rat liver tumor, lung, and spleen treated with DCIP-R1; (c) quantification of fluorescence intensity obtained from (b); and (d) fluorescence imaging of rat liver tumor and healthy liver (control) treated with DCIP-R1. Data are presented as mean ± SD. Significant differences were analyzed using two-way ANOVA with the Sidak’s multiple comparison test. **p < 0.01; ***p < 0.001; and ****p < 0.0001.