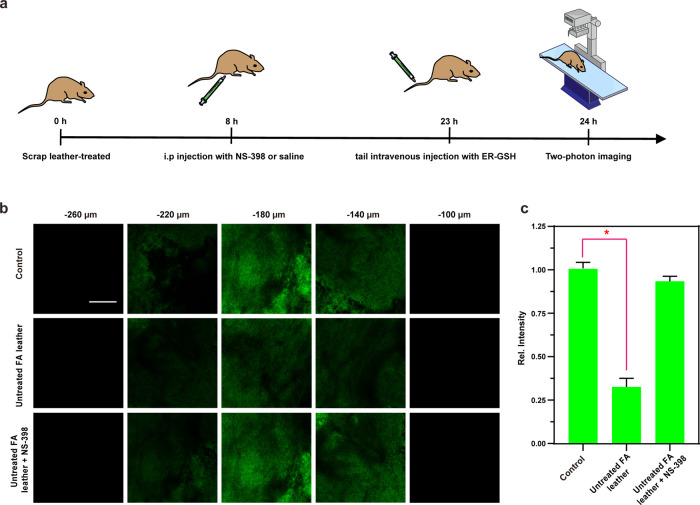
Figure 5.
(a) Schematic illustration of scrap leather and probe treatment. (b) In situ TP fluorescence imaging of the brains of mice and (c) averaged fluorescence changes of ER-GSH loaded (100 μL, 200 μM) brains when subjected to different treatments: Sham group (untreated), Untreated FA leather treatment, and Untreated FA leather + NS-398 treatment. λex = 830 nm; λem = 450–550 nm. Scale bar: 200 μm. The difference was analyzed by one-way ANOVA and Bonferroni post-test. *P < 0.05 vs Control group.

