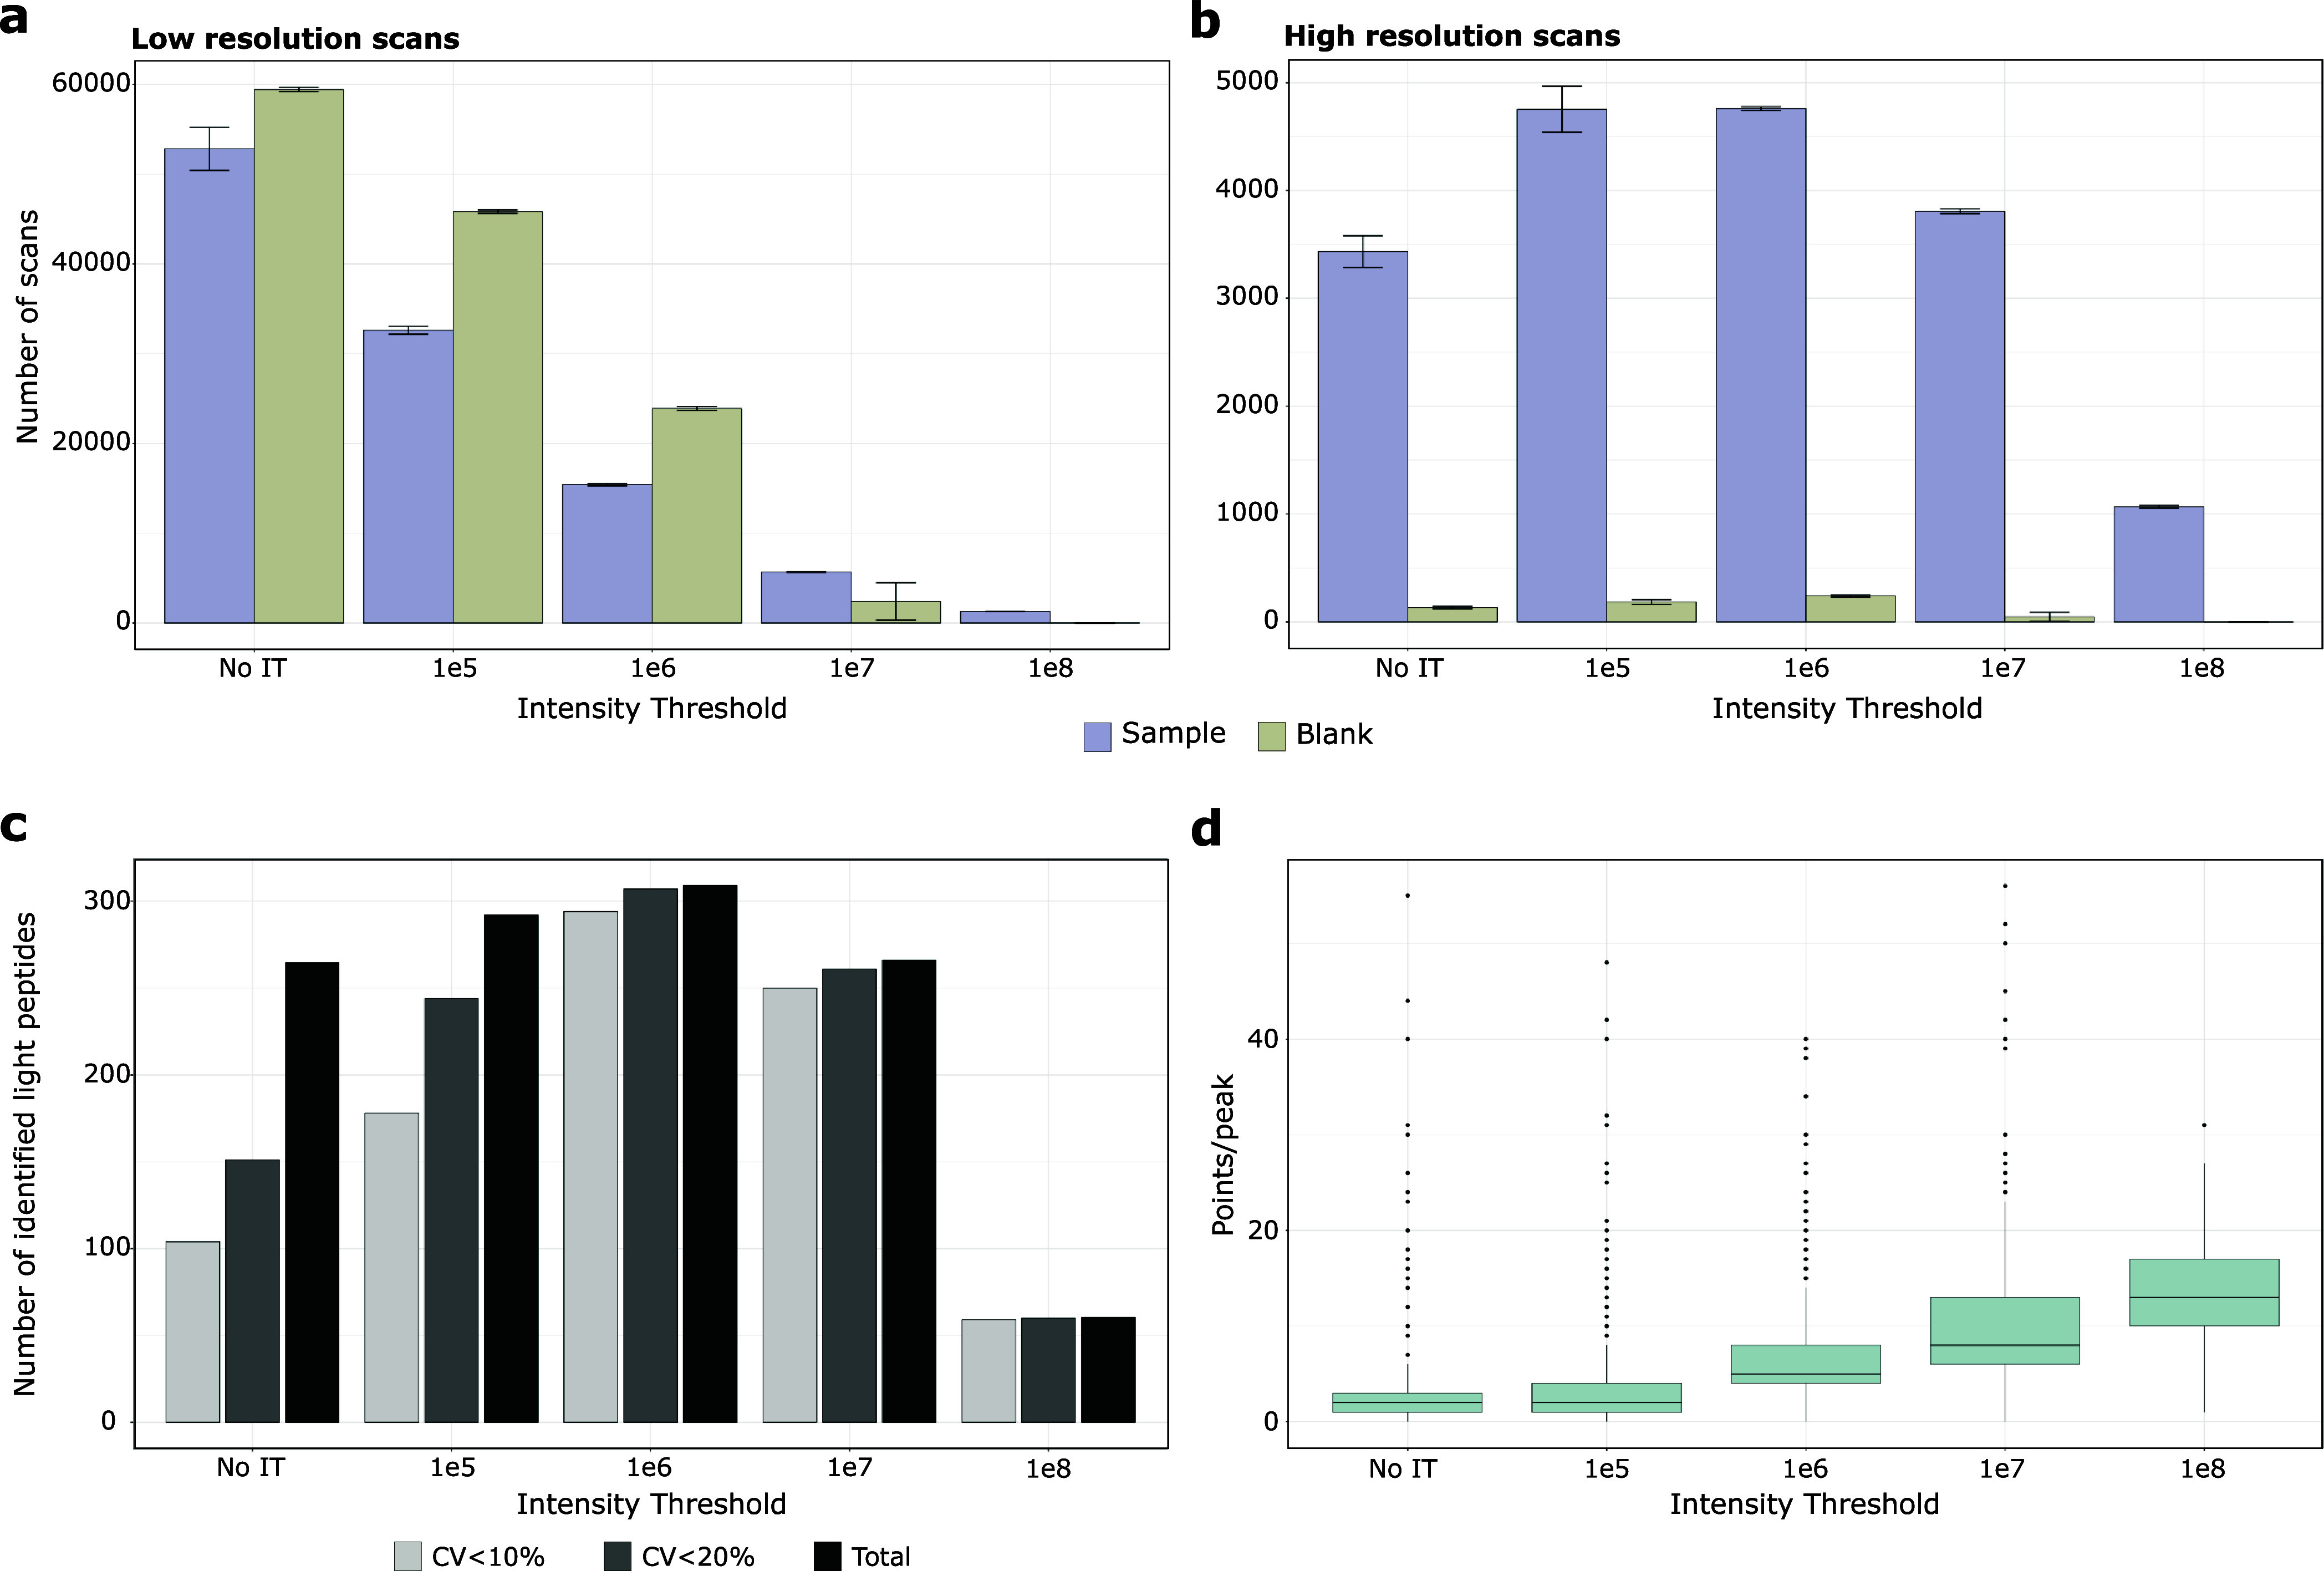
Figure 1.

Distribution of scans based on intensity threshold for samples and blanks and impact on quantification accuracy. a) Counts of low-resolution scans. b) Counts of high-resolution scans. Results are shown with purple bars representing samples containing both light and heavy peptides in a 250 ng HEK background, and light green bars representing blank samples consisting solely of the 250 ng HEK background. The error bars display the standard deviations of the triplicate MS analyses. c) The average identifications of triplicate technical replicates and the number of peptides with CVs below defined thresholds were calculated. d) Box plot visualization of number of points per peak of all identified peptides according to the applied intensity threshold filter. The box plot displays the median (central line), the 25th and 75th percentiles (bottom and top edges of the box), and the whiskers, which extend to 1.5 times the interquartile range from the 25th and 75th percentiles. Data points beyond the whiskers are considered outliers and are shown as individual points.
