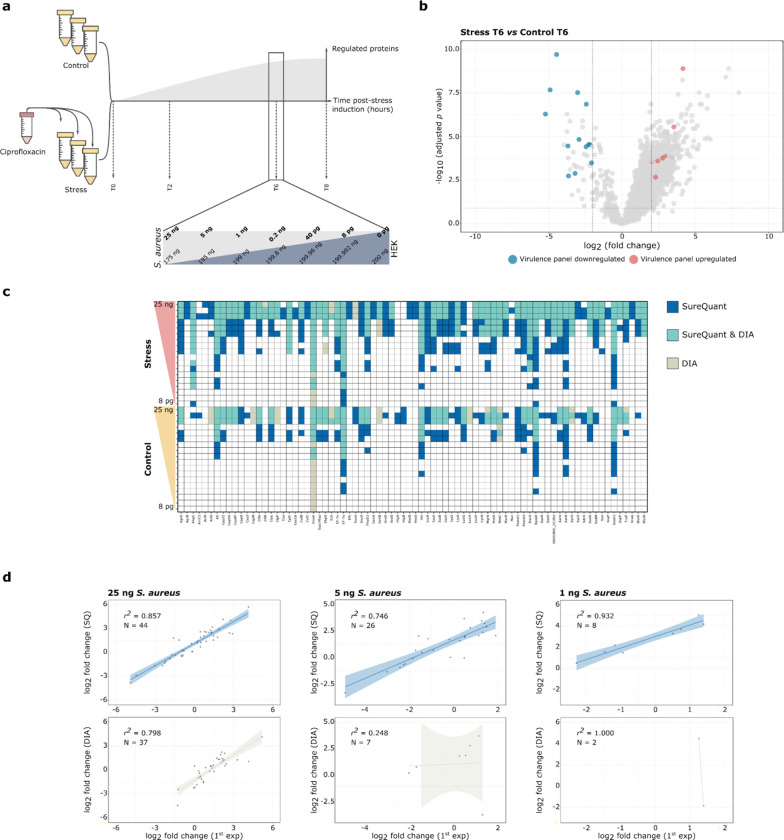
Figure 4.
Comparative analysis of SWATH-MS and SureQuant. a) Time-points for sample harvesting, measured in hours (T0, T2, T6, and T8 h). The panel indicates the amount in ng of S. aureus (light gray) spiked into a HEK background (dark gray) for selected time-point (T6). b) Volcano plot for SWATH-MS based differential abundance proteome analysis of T6. The x-axis represents the log2 fold change (FC), and the y-axis represents the corresponding -log10 adjusted p-value. Proteins significantly up- and downregulated and included in the SureQuant virulence panel are marked in red and blue, respectively. The horizontal dashed line indicates the threshold for proteins where the -log10 adjusted p-value is less than 0.05, while vertical dashed lines delineate the threshold for proteins where −2 ≤ log2(FC) ≤ 2. Proteins that do not meet the threshold criteria (−2 ≤ log2(FC) ≤ 2 and -log10 adjusted p-value <0.05), or are not part of the targeted peptide set, are marked in gray. c) Heatmap for T6 illustrating the qualitative assessment of proteins quantified with SureQuant, SWATH-MS, or both. The upper panel represents stress conditions, while the lower panel represents control conditions. The amount of spiked-in S. aureus increased from bottom to top. d) Correlation between log2 fold changes of SWATH-MS in the original experiment without HEK background (x-axis) and the experiment with decreasing amounts of S. aureus in HEK background for SureQuant (blue upper panel, y-axis) and SWATH-MS (crude lower, y-axis). The number of proteins used for linear regression (N = ) and the R2 value are displayed in the upper left corner of each plot, with the amount of S. aureus spiked into the HEK background presented above the graph.

