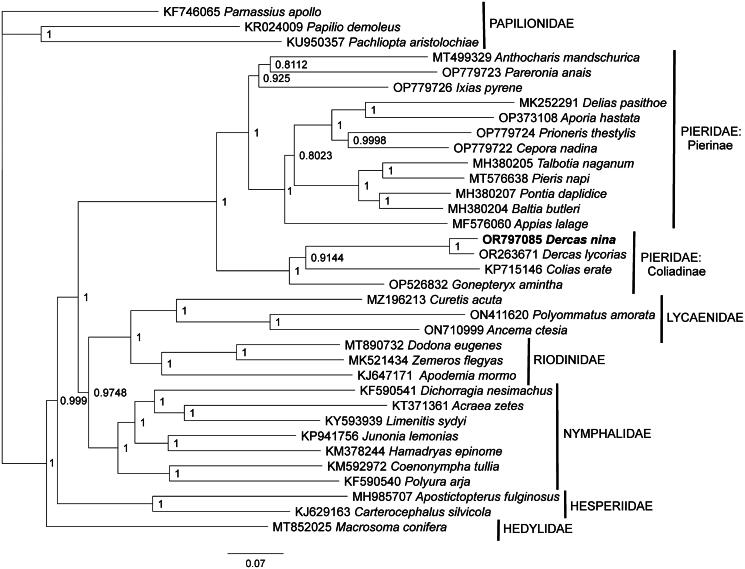
Figure 3.
Bayesian’s inference phylogeny (GTR + I + G model, average deviation of split frequencies = 0.000348, mean estimated marginal likelihood = −193600.98) of the Dercas nina mitogenome, 15 additional mitogenomes from family Pieridae, and 19 species from six other butterfly families (Table 1). Three species in family Papilionidae were used as the phylogenetic outgroup to root the tree. The tree was produced by 10 million iterations in MrBayes with sampling every 1000 generations. At each node, the Bayesian posterior probability values determined by MrBayes are given. The scale bar depicts an average number of 0.7 substitutions per site per unit length.

