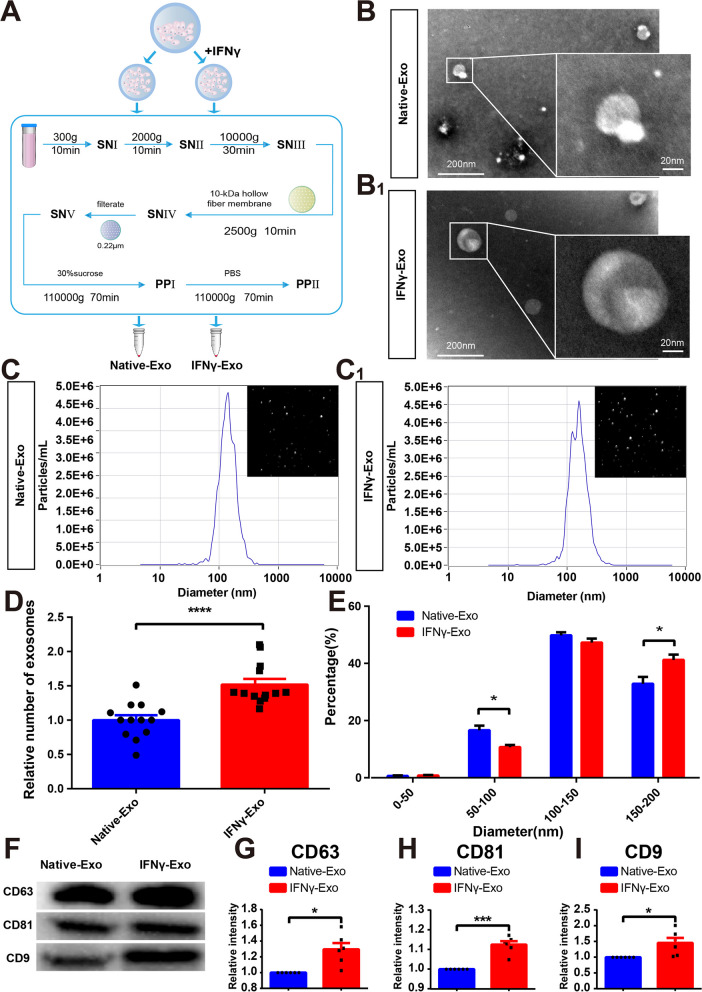
Fig. 1.
Characteristics of exosomes isolated from rat MSCs and the influences of IFNγ pretreatment. A Procedure diagram of the exosomes obtained. B, B1 Typical morphology of exosomes under TEM (n = 3). C, C1 Typical NTA curves and image display of exosomes in the Native-Exo and IFNγ-Exo groups. D The relative number of exosomes in the two groups was analyzed by NTA (n = 12). E NTA was used to analyze the proportion of exosomes of the Native-Exo and IFNγ-Exo groups in different particle size distribution ranges (n = 12). F Representative images of western blot showing exosomal protein markers (CD63, CD81, CD9) in the Native-Exo and IFNγ-Exo groups. G–I Comparison of protein grayscale analysis of CD63, CD81, and CD9 between the Native-Exo and IFNγ-Exo groups (n = 6). Data represent the mean ± SEM.∗ P < 0.05, ∗∗∗P < 0.001, ∗∗∗∗ P < 0.0001. Scale bars: 200 μm, 20 μm

