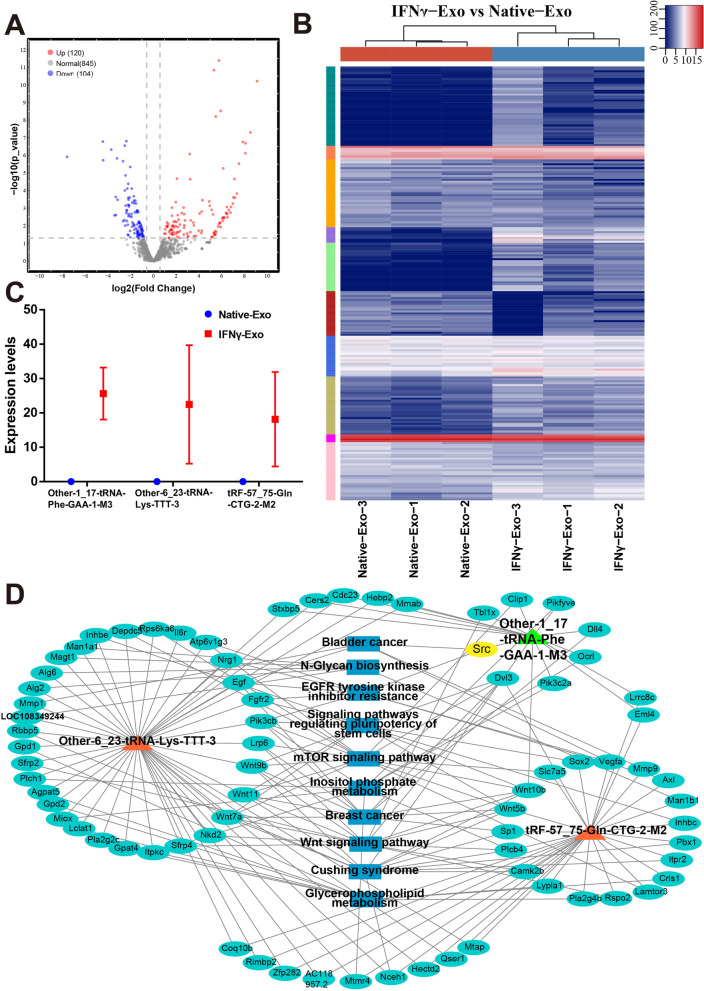
Fig. 5.
Differential expression (DE) analysis of tRF and tiRNA expression profiles in exosomes derived from IFNγ-treated MSCs. A Volcano plot of tRFs and tiRNAs. The values of the X and Y axes in the volcano plot are log2 transformed fold change and log10 transformed p-values between the two groups, respectively. Circles colored in red or blue signify statistically significant differentially expressed tRFs and tiRNAs, displaying a fold change of 1.5 and a p-value of ≤ 0.05 (red indicates up-regulation, while blue indicates down-regulation). On the other hand, circles colored in gray denote non-differentially expressed tRFs and tiRNAs, implying that their fold change and/or q-value fail to meet the determined cutoff thresholds. B Unsupervised hierarchical clustering heatmap for tRFs and tiRNAs. The color in the panel represents the relative expression level (log2-transformed): blue represents an expression level less than the mean, and red represents an expression level greater than the mean. The colored bar on the right side of the panel indicates the divisions that were performed using K-means. C Comparison of CPM values of three tRFs. D The network of the tRF-mRNA pathway, including Other-1_17-tRNA-Phe-GAA-1-M3, Other-6_23-tRNA-Lys-TTT-3, and TRF-57:75-Gln-CTG-2-m2, 77 mRNAs, and 10 pathways. Orange represents tRFs, cyan represents mRNA, and blue represents the pathway

