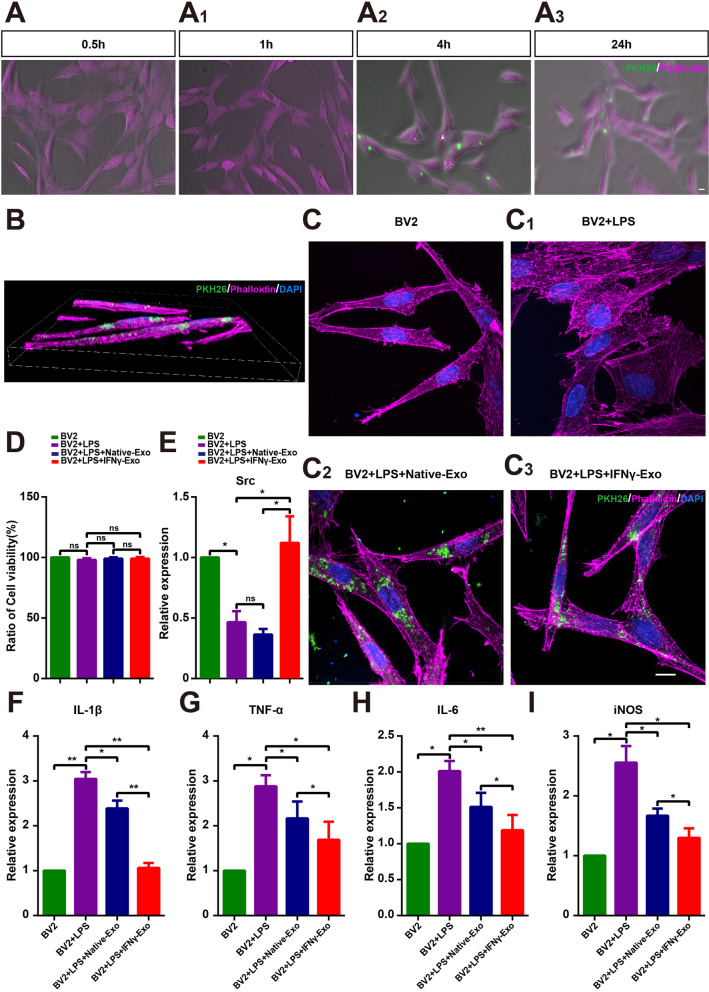
Fig. 8.
IFNγ-pretreated exosomes inhibited activation of BV2 more efficiently. A Representative images of exosome phagocytosis by microglia at different times: (A) 0.5 h; A1 1 h; A2 4 h; A3 24 h. B Three-dimensional reconstructions showing that exosomes are engulfed by microglia 24 h after addition. C Morphological images of phalloidin (purple), PKH26 (green), and DAPI (blue) in the four groups of BV2 cells 24 h after the addition of exosomes. D Comparison of cell viability in different groups by CCK-8 assay (n = 5). E–I Real-time PCR analysis of the expression of Src, IL-1β, TNF-α, IL-6 and iNOS (n = 3). Data represent the mean ± SEM. ns: No significant difference, ∗P < 0.05, ∗∗P < 0.01. Scale bars: 10 μm

