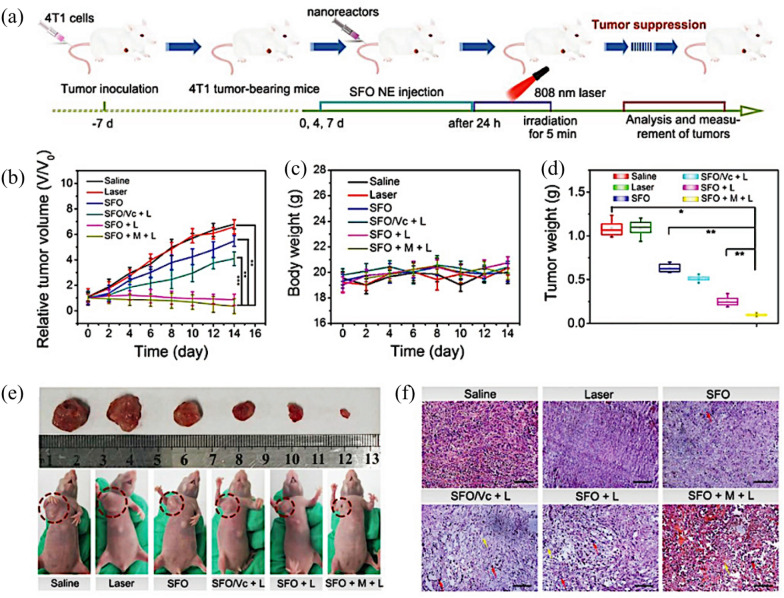
Fig. 19.
In vivo synergistic anti-cancer efficacy with SFO nanozyme. a Schematic illustration of the in vivo anticancer treatment procedure on tumor-bearing mice. b, c Relative tumor volume growth curves and body weight changes of mice after various treatments during the therapy (***p < 0.001, **p < 0.01, or *p < 0.05). d Average weights of tumors collected from different treatment groups. e Representative photographs of excised tumors and corresponding mice collected from different treatment groups. f H&E staining of tumor sections from the tumor-bearing mice in different treatment groups. The yellow and red arrows represent ffbroblast and inffammatory cells. Scale bar: 100 µm [86]

