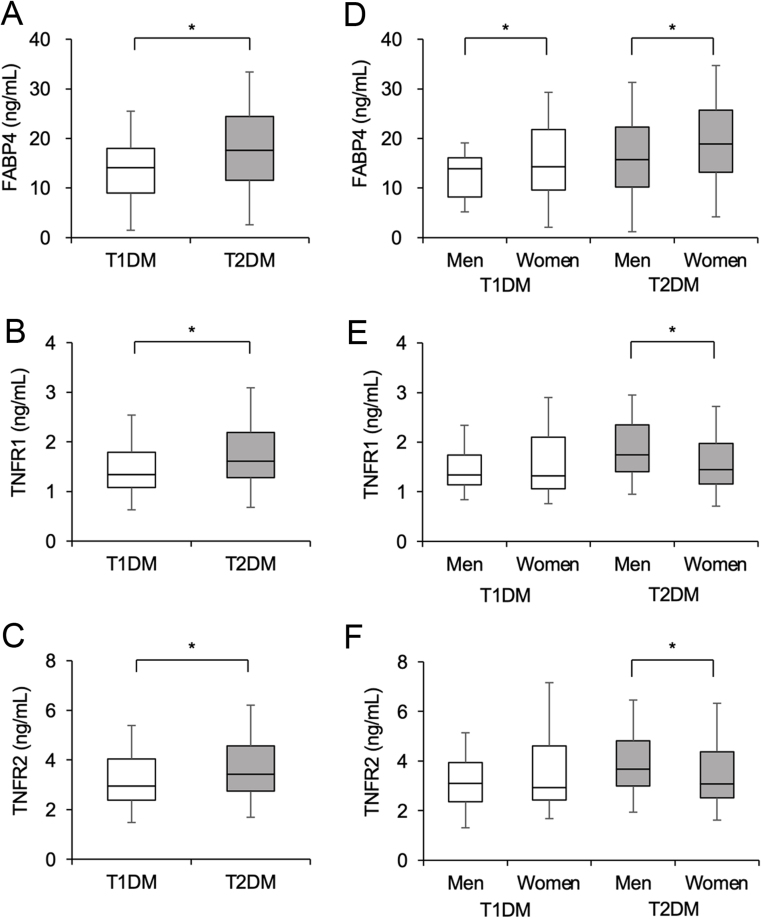
Figure 1.
Concentrations of FABP4, TNFR1, and TNFR2. (A–C) Concentrations of fatty acid-binding protein 4 (FABP4) (A), tumor necrosis factor receptor (TNFR) 1 (B), and TNFR2 (C) in patients with type 1 diabetes mellitus (T1DM, n = 76) and those with type 2 diabetes mellitus (T2DM, n = 575). (D–F) Concentrations of FABP4 (D), TNFR1 (E), and TNFR2 (F) in patients with T1DM (men/women: 31/45) and those with T2DM (men/women: 312/263) divided by sex. Box-and-whisker plots show the median, the first quartile (Q1), the third quartile (Q3), lower outlier (Q1 – 1.5 × interquartile range (IQR)), and higher outlier (Q3 + 1.5 × IQR). *P < 0.05.

 This work is licensed under a