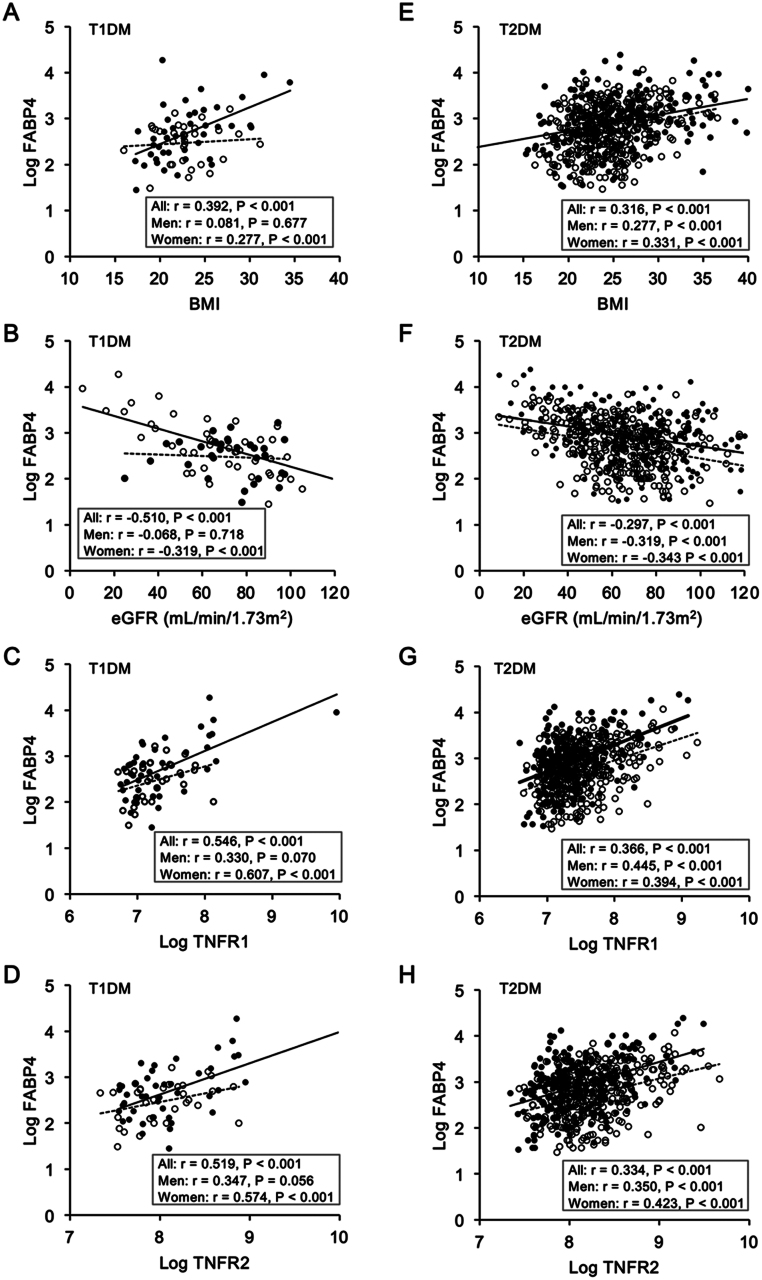
Figure 2.
Correlations of FABP4 levels with metabolic parameters. (A–D) Levels of logarithmically transformed (Log) fatty acid-binding protein 4 (FABP4) were plotted against levels of body mass index (BMI) (A), estimated glomerular filtration rate (eGFR) (B), Log tumor necrosis factor receptor (TNFR)1 (C) and TNFR2 (D) in patients with type 1 diabetes mellitus (T1DM, n = 76).(E–H) Levels of Log FABP4 were plotted against levels of BMI (E), eGFR (F), Log TNFR1 (G), and Log TNFR2 (H) in patients with type 2 diabetes mellitus (T2DM, n = 575). Open circles and broken regression lines: men. Closed circles and solid regression lines: women.

 This work is licensed under a