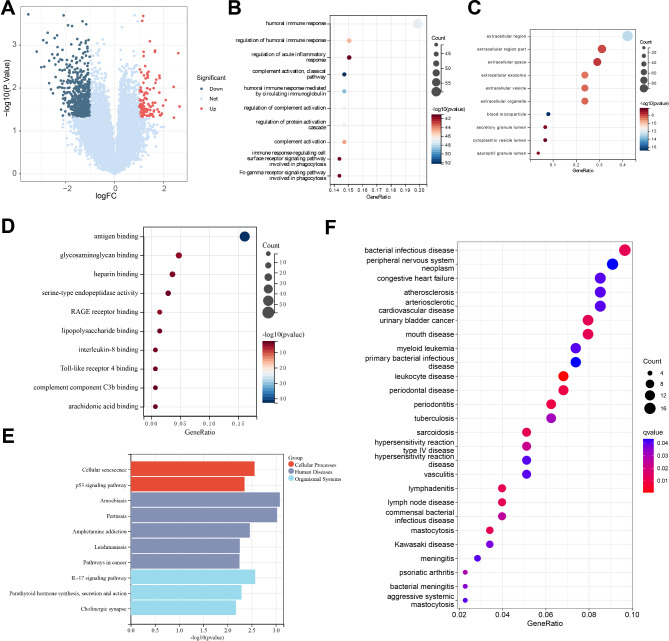
Fig. 1.
Enrichment analysis reveals significant biological changes during the dfu treatment process
Note: (A) Volcano plot of DEGs in peripheral blood between pre-treatment and post-treatment healed DFU patients, with red indicating upregulated genes, blue indicating downregulated genes, and grey indicating genes with no significant difference; (B) Enriched BP in the GO enrichment analysis of DEGs; (C) Enriched CC in the GO enrichment analysis of DEGs; (D) Enriched MF in the GO enrichment analysis of DEGs; (E) Results of KEGG pathway enrichment analysis of DEGs; (F) Results of DO enrichment analysis of DEGs. The sample size for each group of patients was n = 15

