Figure 1.
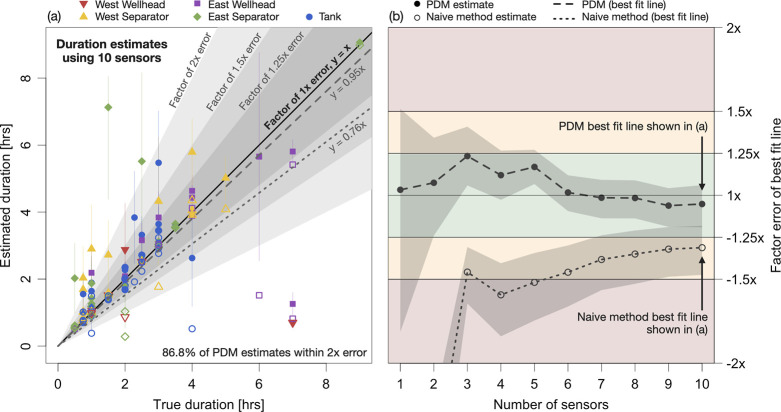
(a) Parity plot of estimated and true durations for the ADED 2023 controlled releases. Solid and empty points correspond to duration estimates from the PDM and naive methods, respectively, with vertical lines showing the 90% interval from the PDM and color showing the true emission source. Dashed and dotted lines show the best linear fit to the PDM and naive estimates, respectively. Gray shaded regions show three different error regimes. (b) Factor of over- or underestimation by the best linear fit to the PDM and naive estimates using different numbers of sensors. Gray shaded regions show the 95% confidence interval on the estimated slope. Negative factor differences indicate underestimation. Colored sections correspond to the three error regimes in (a). Note that the vertical scale is limited to [−2×, 2×] for visual clarity.

