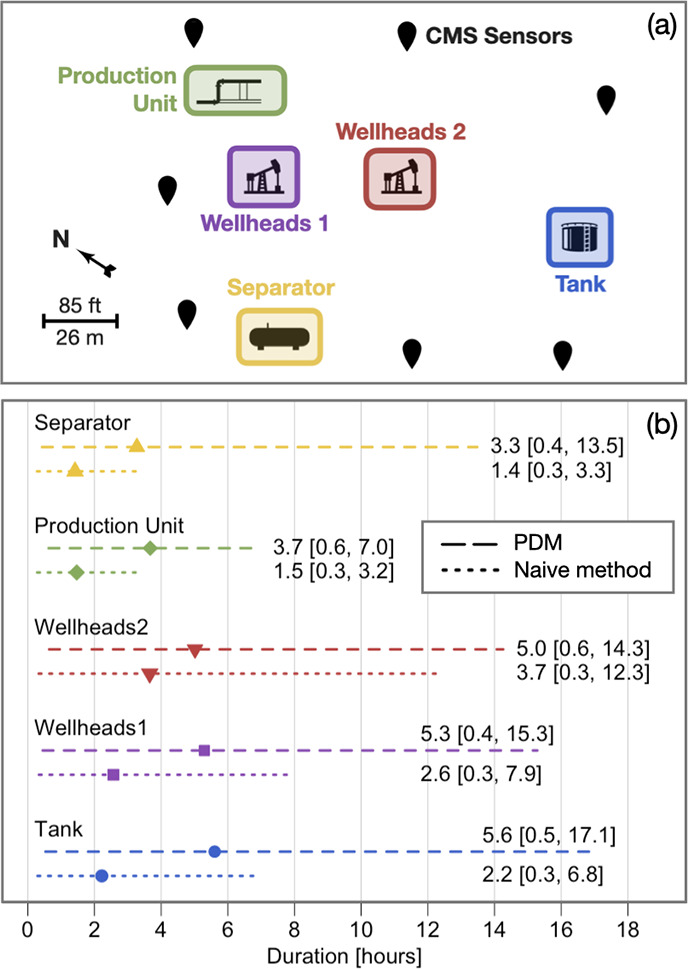
Figure 2.

(a) Schematic of the oil and gas production site used as a case study in this article. (b) Summary of the duration estimates on this site. The left- and right-most points of the horizontal lines show the 5th and 95th percentiles of the duration estimates across all emission events. The marker symbols show the mean duration estimate. These summary statistics are printed on the figure in the following format: mean [5th percentile, 95th percentile].
