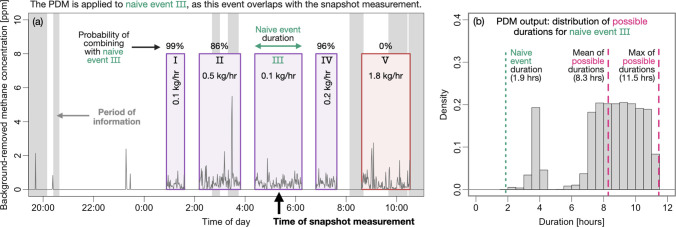
Figure 3.
(a) Example snapshot measurement (time indicated by black arrow) and the overlapping CMS concentration data (spanning September 27, 2023 at 8:00 pm to September 28, 2023 at 10:30am). Enumerated boxes show the naive events, with the color indicating the source estimate (color corresponds to the schematic in Figure 2(a)). Gray shaded regions mark periods of information. Percents indicate the probability of combining each event with the event that overlaps the snapshot measurement. (b) Distribution of possible durations from the PDM for naive event III and correspondingly for the overlapping snapshot measurement.

