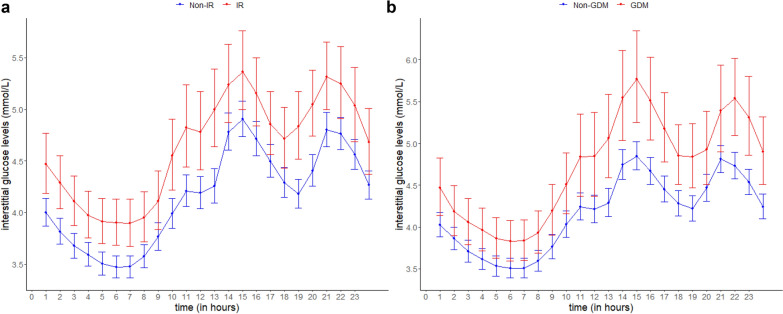
Fig. 1.
The predicted 24-h interstitial glucose levels for women by (a) IR (GMR 1.12; 95% CI 1.05, 1.19) and (b) GDM status (1.11; 1.03, 1.20) based on the GEE analysis. Red represents the women with IR or GDM and blue represents the women with non-IR or non-GDM. The circle markers and capped vertical lines represent the predicted mean daily glucose levels and the respective 95% CI based on the exponentiated log-transformed hourly median glucose values. Models were adjusted for age, ethnicity, years of education, parity, history of GDM or family history of diabetes, pre-pregnancy body mass index, irregular meal, physical activity, and an interaction term between glycemic status and time. CI confidence intervals, GDM gestational diabetes mellitus based on 2013 World Health Organization criteria, GEE generalized estimating equations, GMR geometrical mean ratio, IR insulin resistance based on HOMA2-IR of at least 1.22

