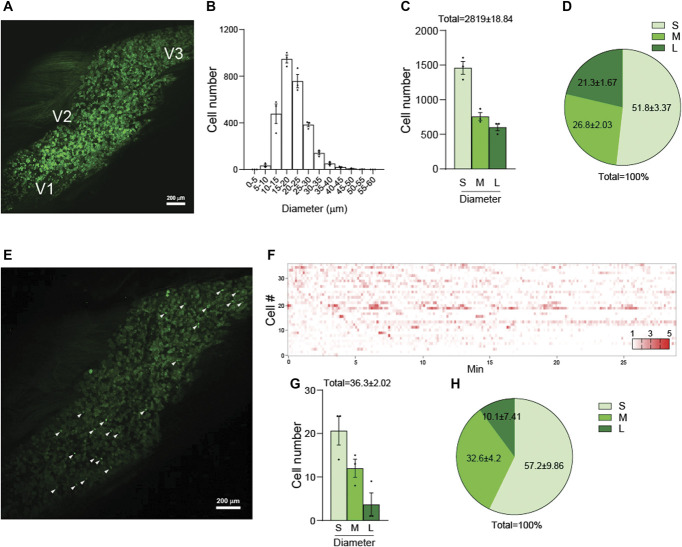
Figure 1.
Visualization and analysis of activated neuronal populations in TG of Pirt-GCaMP3 Mice. (A) Representative image of whole TG captured using in vivo Pirt-GCaMP3 Ca2+ imaging of intact TG. The locations of neuronal cell bodies for V1 (ophthalmic), V2 (maxillary), and V3 (mandibular) are indicated. (B) Histogram depicting the cell number distribution according to cell diameter (μm) (n = 3 mice). (C) Graph showing the cell numbers categorized into 3 groups based on cell diameter: small (<20 μm), medium (20-25 μm), and large (>25 μm) (n = 3 mice). (D) Pie chart representing the percentage composition of each cell diameter size group (n = 3 mice). (E) Representative image of spontaneous activities captured through in vivo Pirt-GCaMP3 Ca 2+ imaging of intact TG. White arrowheads point to spontaneously activated neurons. (F) Representative heatmap displaying the spontaneously activated individual neurons in normal mice. (G) Bar graph showing the number of spontaneously activated neurons, categorized by cell diameter size group (n = 3 mice). (H) Pie chart showing the percentage composition of spontaneously activated neurons according to cell diameter size (n = 3 mice). S: small-diameter TG neurons (<20 μm); M: medium (20-25 μm); L: large (>25 μm). Error bars indicate SEM. TG, trigeminal ganglion.

