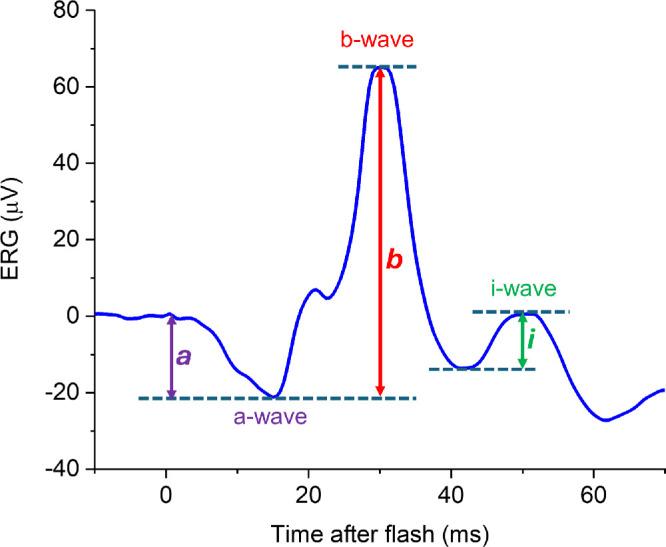
Figure 1.

Example ERG elicited by the international standard light-adapted single flash (LA3 ERG). The stimulus comprises a white flash of 3 cd·s·m−2 delivered on a 30 cd·m−2 white light-adapting background through a dilated pupil (following at least 10 minutes of adaptation to the background). The trace shown is the averaged response to > 50 flashes. The conventionally measured components (a-wave and b-wave) are labeled. The a-wave amplitude is measured from the baseline to the a-wave trough (purple double-headed arrow); the b-wave amplitude is measured from the a-wave trough to the b-wave peak (red double-headed arrow). After the b-wave is a negative trough, followed by a small positive-going peak, designated the “i-wave.” The amplitude is measured from the preceding negative trough as shown (green double-headed arrow).
