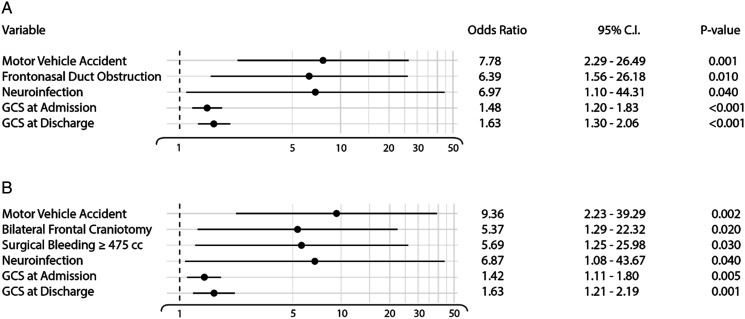
Figure 2.
Multivariate regression model controlled by age, sex, and intracranial involvement represented in a Forrest Plot. (A) Selected variables of the general population introduced to the multivariate regression model. (B) Selected variables of the patients who underwent surgical intervention introduced to the multivariate regression model.

