
Figure 4.
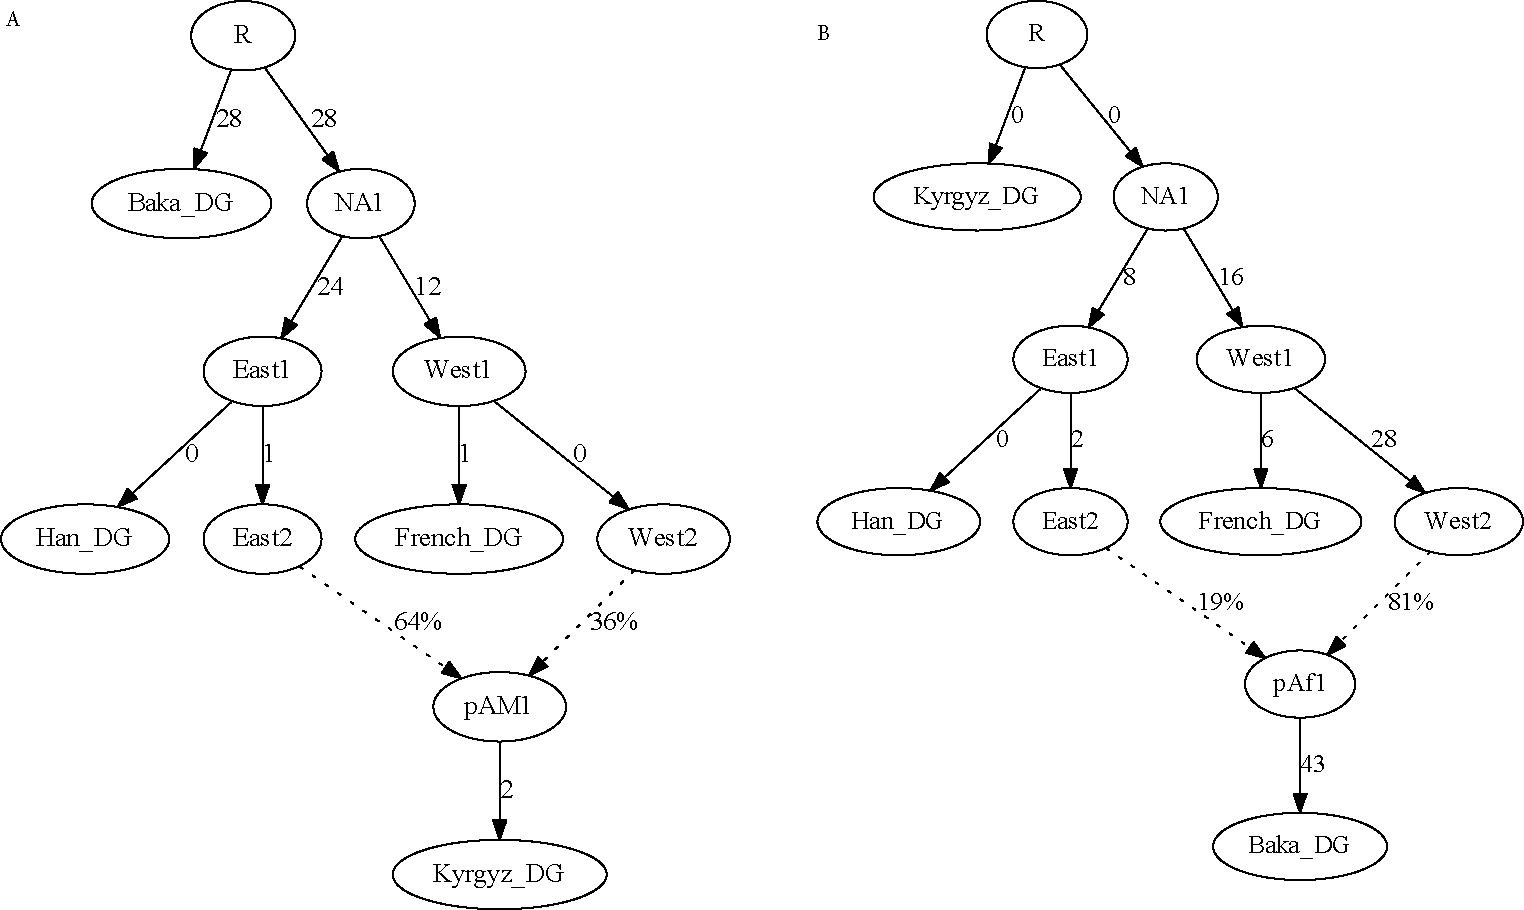
Four-population admixture graphs with Kyrgyz in place of Mixe, modeling either (A) Kyrgyz or (B) Baka as admixed. The first provides a perfect fit to the data, whereas the second has residuals up to Z = 27.
Official websites use .gov
A
.gov website belongs to an official
government organization in the United States.
Secure .gov websites use HTTPS
A lock (
) or https:// means you've safely
connected to the .gov website. Share sensitive
information only on official, secure websites.
Four-population admixture graphs with Kyrgyz in place of Mixe, modeling either (A) Kyrgyz or (B) Baka as admixed. The first provides a perfect fit to the data, whereas the second has residuals up to Z = 27.