
Figure 6.
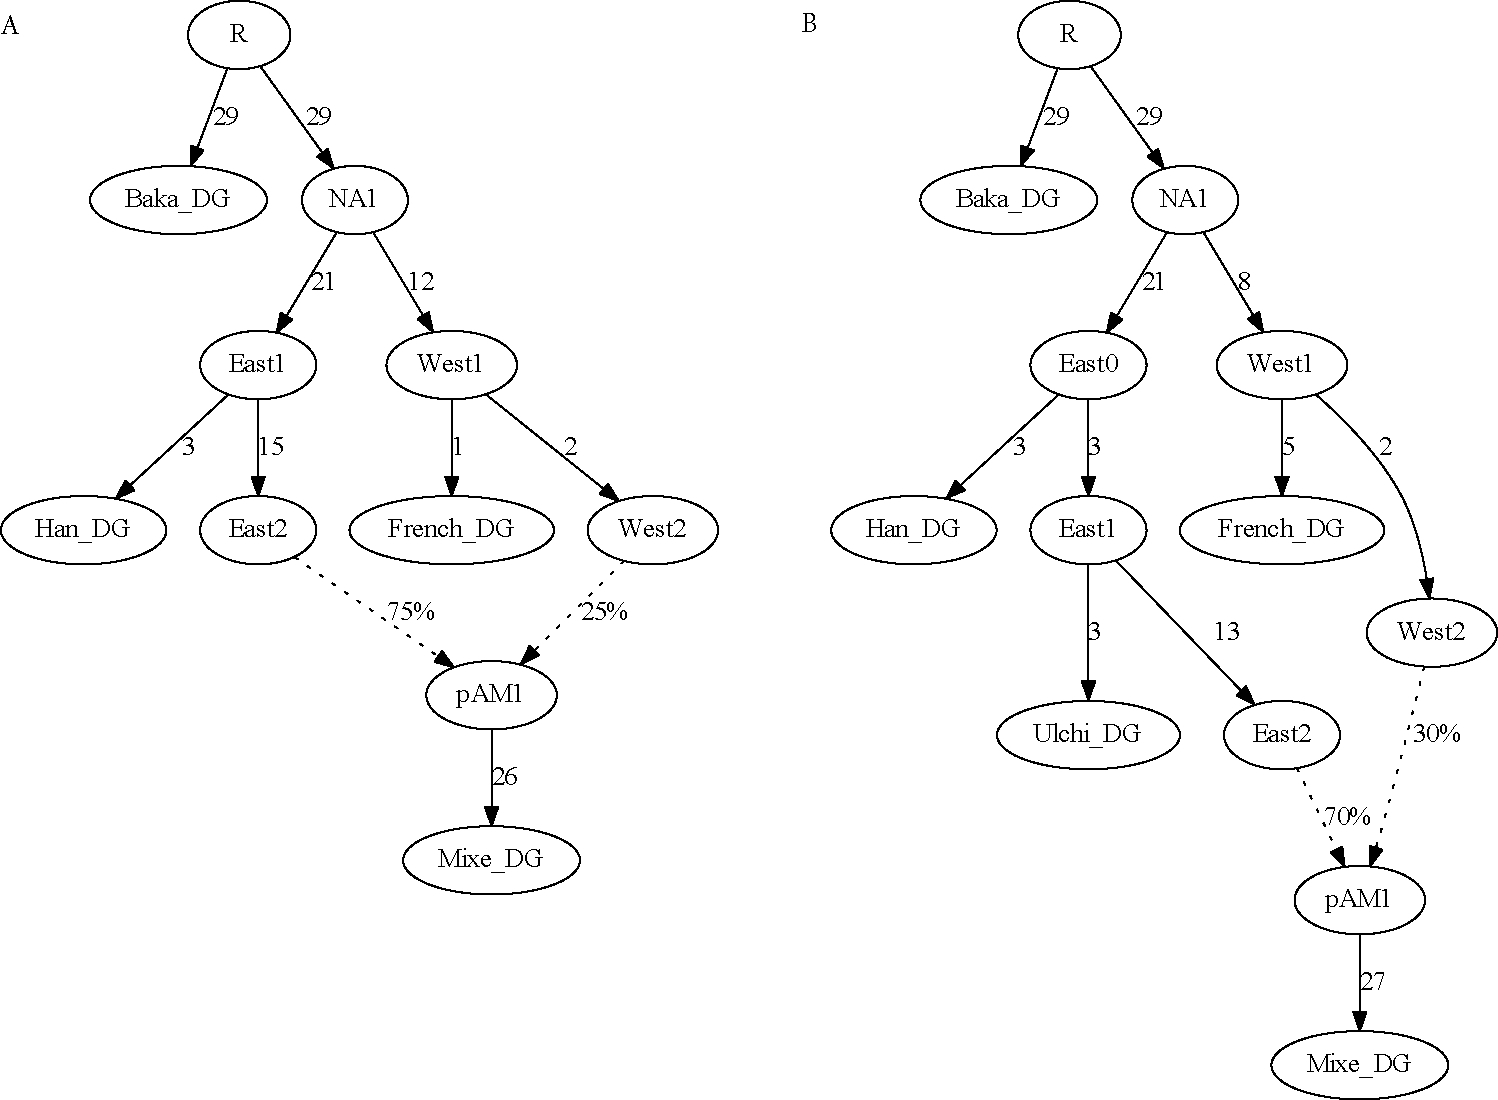
Admixture graphs with pre-specified mixture proportion parameters. (A) Four-population model, with the proportion locked at 75%; the fit is perfect. Note that the branch lengths shift slightly relative to Fig. 3A. (B) Five-population model, with the proportion locked at 70%; residual statistics (indicating a need for more eastern Eurasian ancestry in Mixe) are present up to Z = 2.6.