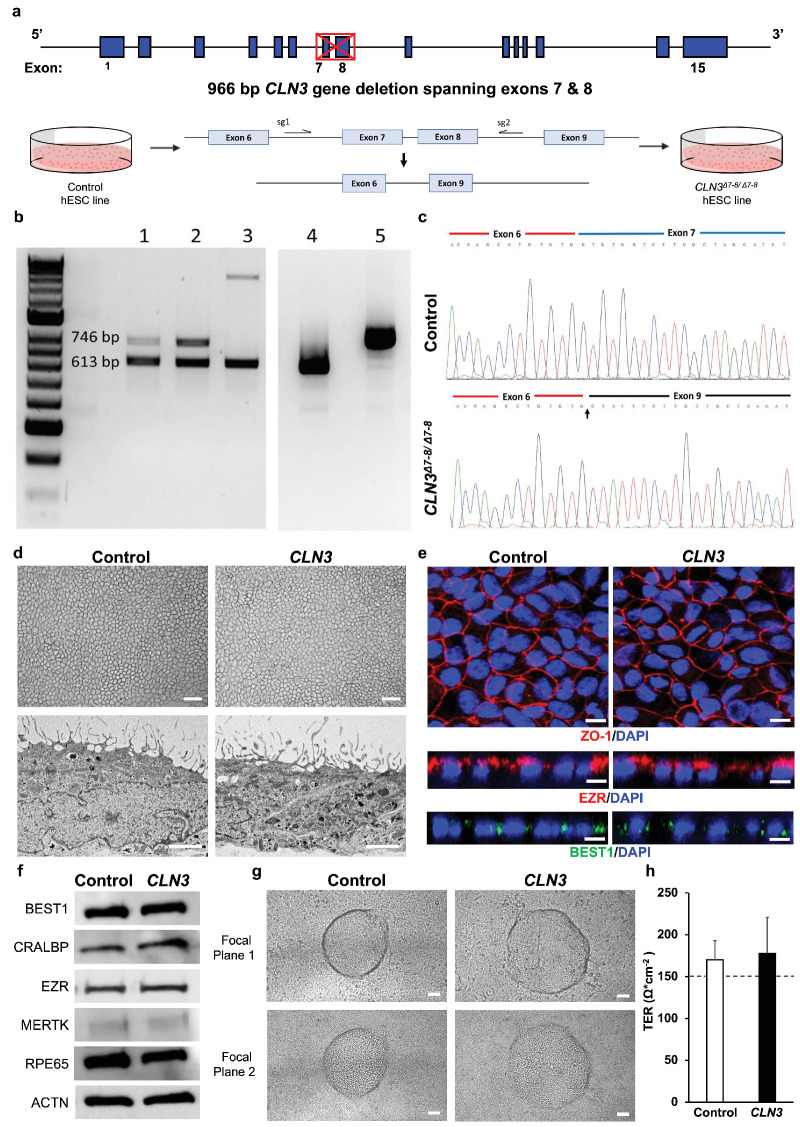
Figure 1.
Generation and characterization of isogenic control and CLN3 hESC RPE. (a) Schematic depicting CRISPR-Cas9 deletion of exons 7 and 8 of CLN3 in H9 hESC. Note the CLN3 locus and the location of dual guides to excise exons 7 and 8 from the CLN3 gene. (b) Identification of exons 7 and 8 deletion in CLN3 gene in positive clones. Genomic PCR of clones with homozygous deletion (lanes 1 and 2) and heterozygous deletion (lane 3). RT-PCR analysis of homozygous 1kb deletion clone (lane 4) and control (lane 5). (c) Sequencing alignment of cDNA for control (top) and CLN3Δ7-8/Δ7-8 (bottom) cell lines shows successful biallelic deletion of exons 7 and 8 reflected as splicing of exon 6 to exon 9 (indicated by an arrow). (d) Representative light microscopy images (top) and electron microscopy images (bottom) showing the expected RPE morphology and apical microvilli in isogenic control and CLN3Δ7–8/Δ7–8 hESC RPE (CLN3 hRPE) (scale bar, 100 µm). (e) Representative confocal microscopy images showing similar and expected localization of tight junction protein, ZO1 (red, top), RPE microvilli protein, EZR (red, middle), and basolaterally expressed RPE protein, BEST1 (green, bottom) in control and CLN3 hRPE cells. Nuclei were stained with DAPI (blue) (scale bar, 10 µm). (f) Representative Western blot images showing expected presence of RPE signature proteins and ACTN in both control and CLN3 hRPE cells. (g) Representative light microscopy images showing evidence of transepithelial fluid flux with presence of fluid domes in polarized monolayers of control and CLN3 hRPE cells. Note the presence of RPE both within the fluid dome (focal plane 1, top) and outside the fluid dome (focal plane 2, bottom) (scale bar, 50 µm). (h) TER measurements showing evidence of a tight epithelial monolayer in both control and CLN3 hRPE cultures. Note the dotted line represents the known TER threshold for RPE cells in vivo53. n ≥ 3 for all experiments in Figure 1.

