. 2024 Nov 7;24(24):5360–5373. doi: 10.1039/d4lc00659c

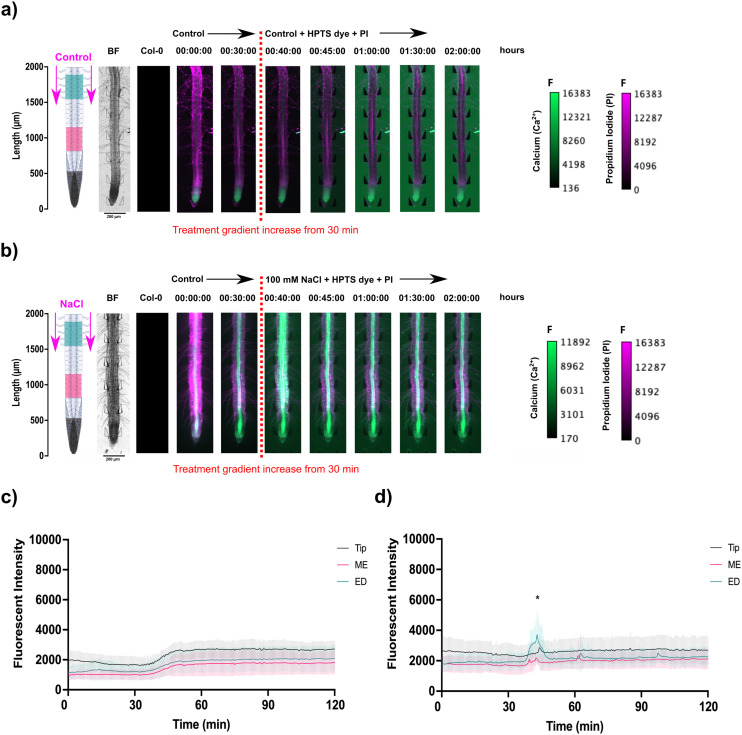
Fig. 4. Propidium iodide (PI) staining of A. thaliana G-CaMP3 roots and the resulting spatiotemporal localisation of fluorescence following solution change through inlets A & B at the shoot site. The continuous flow (20 μL min−1) of control media (1/2 MS/0.31 mM MES) was maintained for 30 minutes. Original video files are 0.05 fps. Solution change caused the gradient shown for control and 100 mM NaCl for 2 hours. Root schematics on the left depict treatment application (magenta arrows) and the rectangular regions of interest (refer to key). The bright field (BF) channel and control (wild type Col-0) roots are displayed adjacently (scale; F = fluorescence intensity). (a) Under control conditions, PI stain (RFP; magenta) was transported shoot-wards through the xylem over 2 hours, following the treatment switch to control media supplemented with HPTS dye (n = 3). No Ca2+ burst indicated by the G-CaMP3 is observed. (b) During salinity stress, the PI fluorescence indicated reduced transported through the xylem and phloem over 2 hours after the introduction of 100 mM NaCl supplemented with HPTS dye (n = 4). The Ca2+ burst indicated by the G-CaMP3 was observed upon 100 mM NaCl introduction at approximately 37 minutes. (c) Line graph with two-way ANOVA multiple comparisons Tukey's honestly significant difference (HSD) mean comparison test (P-value ≤ 0.05) depicting average fluorescence intensity (grey scale; pixel brightness) of G-CaMP3 within three rectangular regions of interest (tip, maturation/elongation (ME) zone and elongation/differentiation (ED) zone) upon targeted exposure of control treatment for a duration of 2 hours (n = 3). (d) Line graph depicting average fluorescence intensity of G-CaMP3 across three rectangular regions upon the solution change to 100 mM NaCl treatment for a duration of 2 hours (n = 4). All experiments used a concentration of 0.01 mM HPTS dye (green). Asterisks (*) indicate statistical significance.

Fig. 4