. 2024 Nov 7;24(24):5360–5373. doi: 10.1039/d4lc00659c

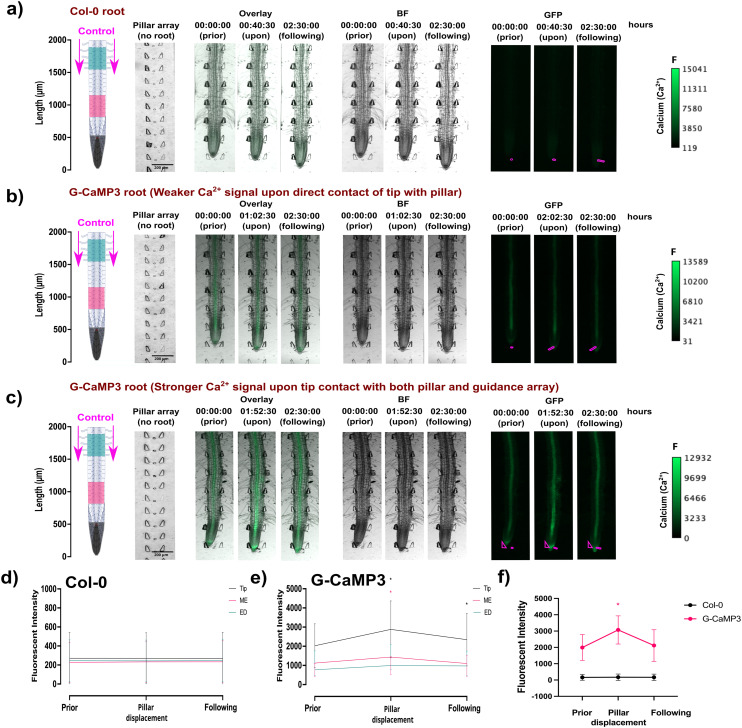
Fig. 7. The spatiotemporal localisation of Ca2+ signals in both A. thaliana wild type Col-0 and transgenic G-CaMP3 roots was observed at the tip before, during, and after touch stress for 2.5 hours. Displayed on the left are root schematics depicting control (1/2 MS/0.31 mM MES) treatment application (magenta arrows) with rectangular regions of interest highlighted (refer to key). Bright field (BF) with the pillar array in the absence of a root is displayed adjacently (scale; F = fluorescence intensity), followed by an overlay of the BF and GFP channel. Pillars are overlayed in the GFP channel for display purposes (magenta lines). Line graphs depict normalised (ΔF/F) fluorescence intensity (grey scale; pixel brightness) across linear sections or the root tip with a two-tailed paired t-test (P-value ≤ 0.05) with a 95% confidence interval. Original video files are 0.1 fps. (a) A Col-0 root depicting no fluorescence increase upon root tip contact with a displaceable micropillar. (b) A G-CaMP3 root depicting a non-directional localised Ca2+ release indicated by the G-CaMP3 at the tip and elongation zone upon root tip contact with a displaceable micropillar at approximately 2 hours. (c) A G-CaMP3 root depicting a strong directional Ca2+ release indicated by the G-CaMP3 at the tip, elongation zone and differentiation zone after root tip contact with both the displaceable micropillar and guidance array at approximately 1 hour 52 minutes. (d) Line graph showing the average fluorescence intensity in Col-0 roots within three rectangular regions of interest (tip, maturation/elongation (ME) zone and elongation/differentiation (ED) zone) upon force sensing at the tip (n = 5). (e) Line graph showing the average fluorescence intensity of G-CaMP3 within three rectangular regions of interest upon force sensing at the tip (n = 5). (f) Line graph showing the average fluorescence intensity at the root tip in Col-0 and G-CaMP3 plants (n = 5).

Fig. 7