. 2024 Nov 7;24(24):5360–5373. doi: 10.1039/d4lc00659c

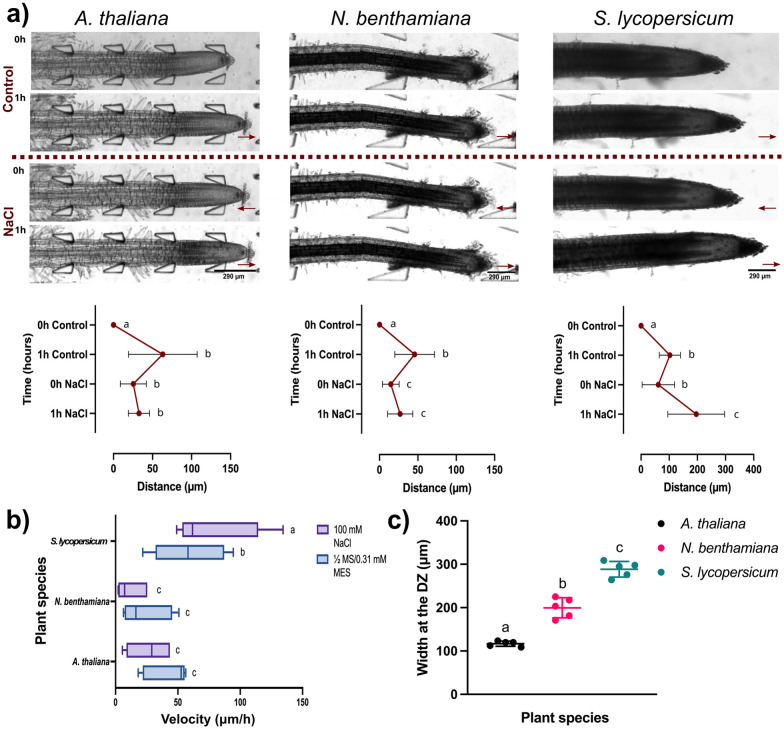
Fig. 8. Root growth analysis conducted on A. thaliana, N. benthamiana and S. lycopersicum under varying solute concentrations. Treatments alternated between control (1/2 MS/0.31 mM MES) and salinity stress (100 mM NaCl) using the MMDS. The growth of the same roots is shown over time in each condition. Original video files are 0.08 fps. (a) Bright field image of root growth of the three plant species after control treatment for 1 h followed by salinity treatment for 1 h (scale bar = 290 μm). The maroon line indicates the switch from control to NaCl treatment. All graphs depict paired t-test (two-tailed) with a confidence level of 95% (P < 0.05). Plots show the average root growth (μm) of the three plant species under control and salinity treatments for 1 h (n = 5). (b) Box and whisker plot comparing the average root velocity (μm h−1) of the three species under control and salinity treatments (n = 5). (c) Scatter plot comparing the average root width (W) of the three plant species at the differentiation zone (DZ) (n = 5).

Fig. 8