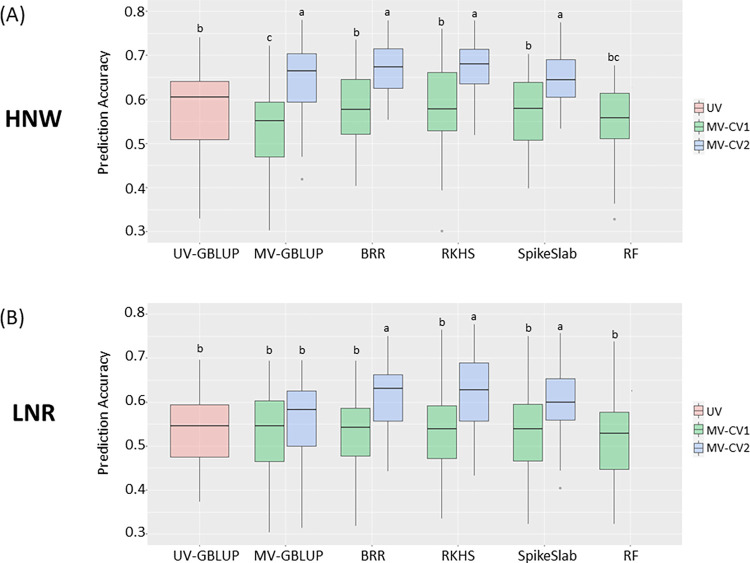
Fig 4. Prediction accuracy for grain yield with correlated traits.
Comparison of prediction accuracy (PA) for grain yield among univariate (GBLUP) and the multivariate models (MV-GBLUP, BRR, RKHS, Spike and Slab regression, and RF) in both multivariate cross-validation schemes (MV-CV1 and MV-CV1). The Random Forest (RF) model was performed only in MV-CV1. This analysis was performed separately for (A) high nitrogen and well-watered (HNW), and (B) low nitrogen and rainfed (LNR) conditions. Duncan’s test, represented by letters, was used to identify and discern statistical differences among the PAs.

