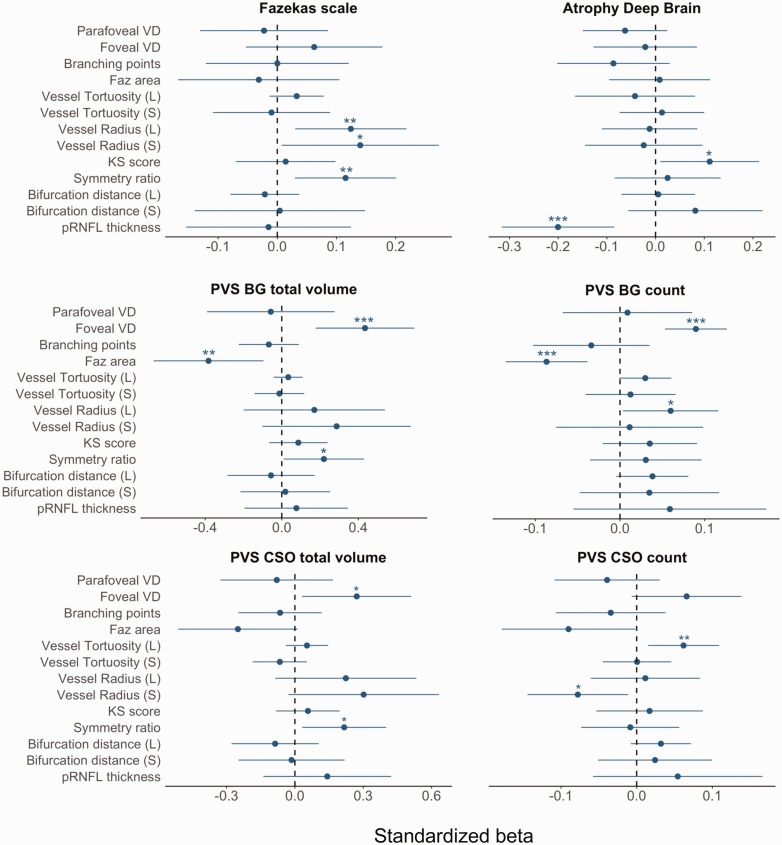
Figure 2.
Standardized betas with 95% confidence interval (CI) of retinal and brain variables using GEE model adjusted for age, sex, systolic blood pressure, self-reported diabetes status, BMI, hypercholesterolemia, smoking status, and image quality. PVS volumes were corrected for the volume of the relevant region of interest. PVS: perivascular spaces; CSO: centrum semiovale; BG: basal ganglia. CI containing the value zero (dashed line) indicates an unadjusted p-value > 0.05, while *: p-value ≤ 0.05, **: p-value ≤ 0.01, ***: p-value ≤ 0.001. VD: vessel density, FAZ: foveal avascular zone, KS: Kolmogorov-Smirnov, L: large vasculature, S: small vessels.

