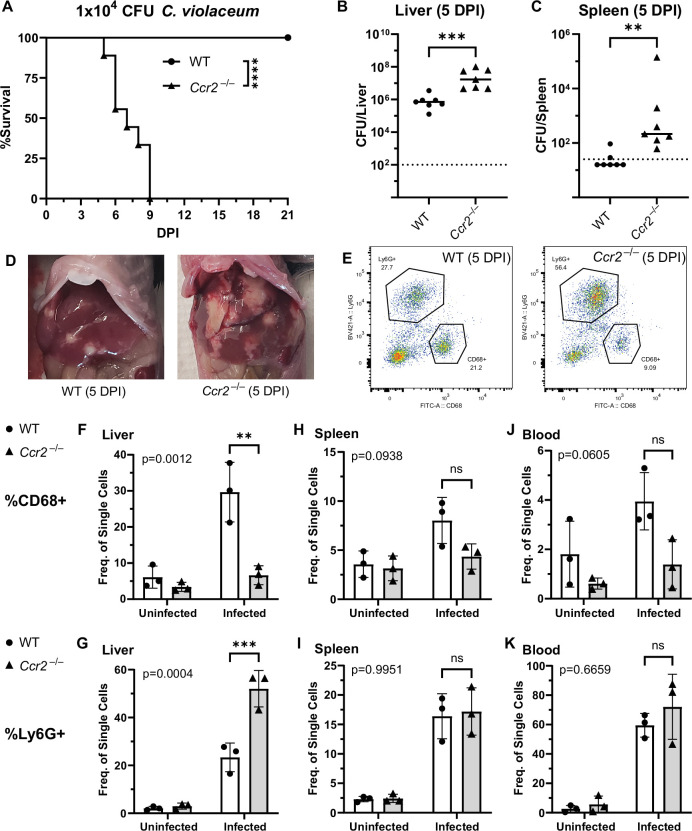
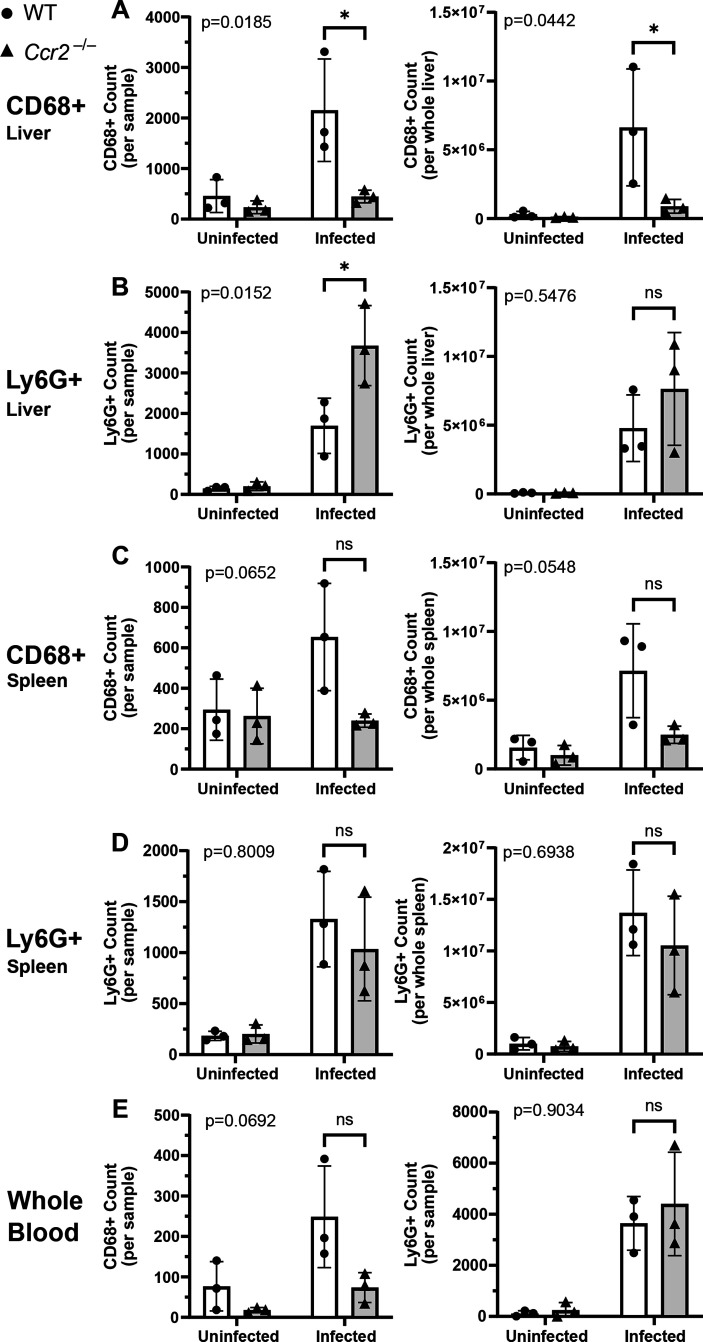
Figure 6. CCR2 and monocyte recruitment are essential for a successful granuloma response to C. violaceum.
Wildtype (WT) and Ccr2–/– mice were infected intraperitoneally (IP) with 1 × 10⁴ CFU C. violaceum. (A) Survival analysis of WT (N = 10) and Ccr2–/– (N = 9) mice. Two experiments combined. Mantel–Cox test, ****p < 0.0001. (B–K) Livers and spleens were harvested 5 days post-infection (DPI). Bacterial burdens in the (B) liver and (C) spleen of WT and Ccr2–/– mice. Two experiments combined. Each dot represents one mouse. (B) Two-tailed t test (normally distributed data); ***p = 0.0002. (C) Mann–Whitney (abnormally distributed data); **p = 0.0012. Dotted line, limit of detection. Solid line, median. (D) Gross images of WT and Ccr2–/– livers 5 DPI. (E) Gating strategy for analysis of neutrophil (Ly6G+) and macrophage (CD68+) numbers via flow cytometry. Liver samples from infected mice shown. Frequency of CD68+ macrophages from single-cell gate in the (F) liver, (H) spleen, and (J) blood. Frequency of Ly6G+ neutrophils from single-cell gate in the (G) liver, (I) spleen, and (K) blood. (F–K) Three experiments combined using only female mice. Each dot represents one mouse, with 10,000 events collected per sample. Two-way ANOVA (for multiple comparisons to assess genotype and infection); key comparisons and p-values shown. Line represents mean ± standard deviation.


