Figure 3.
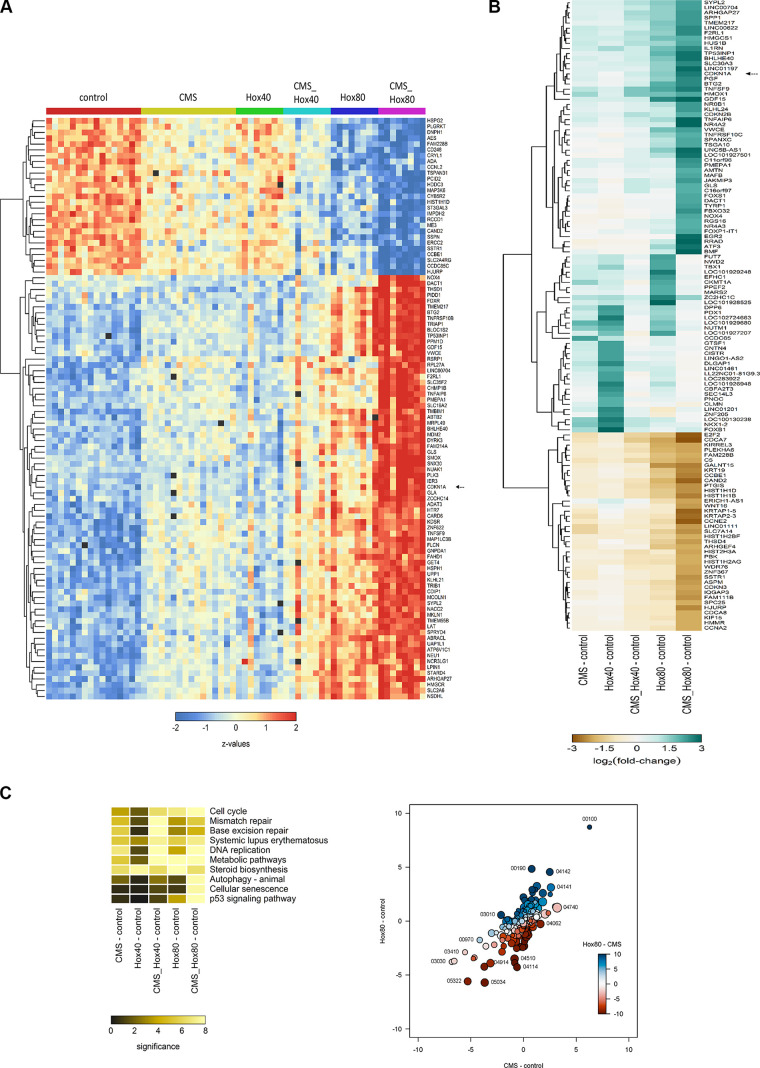
Cyclic mechanical stretch (CMS) and hyperoxia (HOX) activate p21 signaling in lung resident mesenchymal stem cell (MSC) of preterm infants. A: heatmap of the expression profiles for the 100 genes with highest F-statistics following 24 h of exposure to CMS and/or HOX 80%. Colors encode row-wise z-scores. Black boxes indicate missing values (spots excluded from the analysis because of structural artifacts). Genes with most prominent differential expression and smallest signal-to-noise ratio are selected, n = 16 samples. B: heatmap of the average log2 fold-changes against control of all genes being regulated at least twofold and in the same direction in all comparisons against the control. C, left: heatmap of the statistical significance of pathway perturbation by treatment of the 10 pathways with the highest statistical significance. The significance values are −log10(P values) from gene set tests performed on the ranks of the gene-wise moderated t statistics. Higher values (brighter colors) indicate lower P values, that is, a statistically more significant perturbation of the expression of the genes in the pathway based on enrichment score. Right: bubble plot summarizing results from KEGG pathway analyses. All axes show the signed statistical significance of the perturbation from the gene set tests. The sign indicates the sign of the direction of the perturbation. For instance, positive values on the y-axis indicate a stochastically higher expression of the genes under HOX 80% than under control conditions, negative values indicate a lower expression under HOX 80% than under control conditions. The colors indicate the signed significance from the gene set tests comparing the expression under HOX 80% than and control conditions directly. Each bubble represents one KEGG pathway, the size of the bubble is proportional to the number of genes in the pathway. Some outer bubbles were annotated with the respective KEGG pathway ID.

