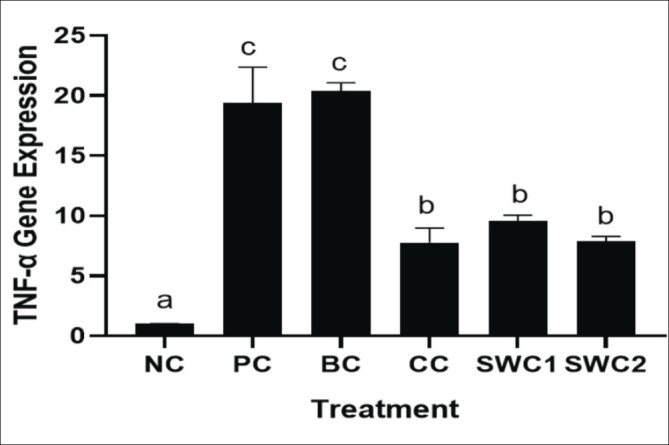
Fig. 10. TNF-α gene expression in rat gingival tissue. *Data are presented as mean ± standard deviation. For each treatment, testing was carried out in four repetitions. * NC: Negative control, PC: Positive control (Bacterial induced rats), BC: Base cream control (1 × oral BC applied), CC: Comparative control (1× kenalog cream applied), SWC1: Sappan cream 1 (PC + 1 times cream applied), SWC2: Sappan cream 2 (PC + 2 times cream applied). Different superscripts (a,b,c,d) mark significant differences among treatment based Dunnet T3 test.

