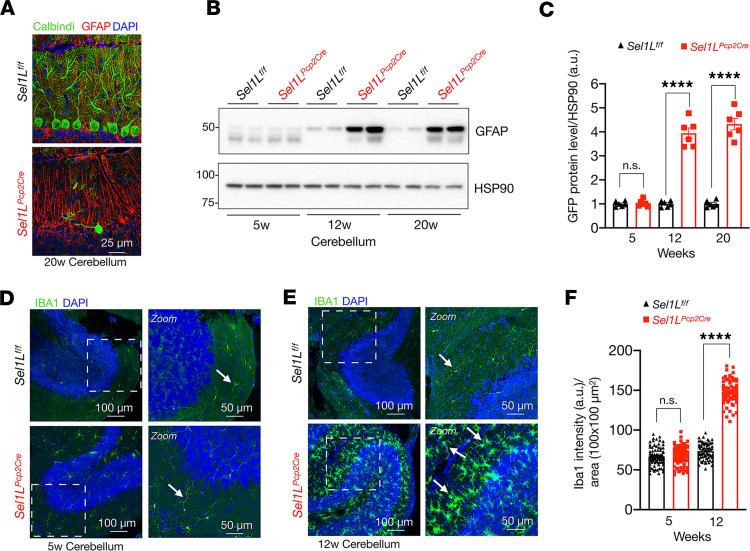
Figure 6. Elevated astrocyte activation and microglia proliferation in Sel1LPcp2Cre mice.
(A) Confocal images of Purkinje cells stained with calbindin (green) and GFAP for astrocyte cells (red) in Sel1Lf/f and Sel1LPcp2 mice at 20 weeks of age (n = 3 mice per group). (B) Western blot analysis of GFAP in the cerebellum of 5-, 12-, and 20-week-old mice, with quantitation shown in C (n = 6 per group). Values shown are in kDa. (D and E) Confocal images of IBA1-positive microglia (green) and DAPI (blue) staining in the cerebellum of 5- (D) and 12-week-old (E) mice (n = 3 mice per group). Arrows indicate microglial cells. (F) Quantitation of IBA1-positive microglia cells in the cerebellum of 5- and 12-week-old mice. Data are shown as the mean ± SEM. *P < 0.05, **P < 0.01, ***P < 0.001, ****P < 0.0001, by 2-way ANOVA followed by Bonferroni’s multiple comparisons test (C and F). Scale bar: 25 μm (A); 50 μm (D and E, second column); 100 μm (D and E, first column).

