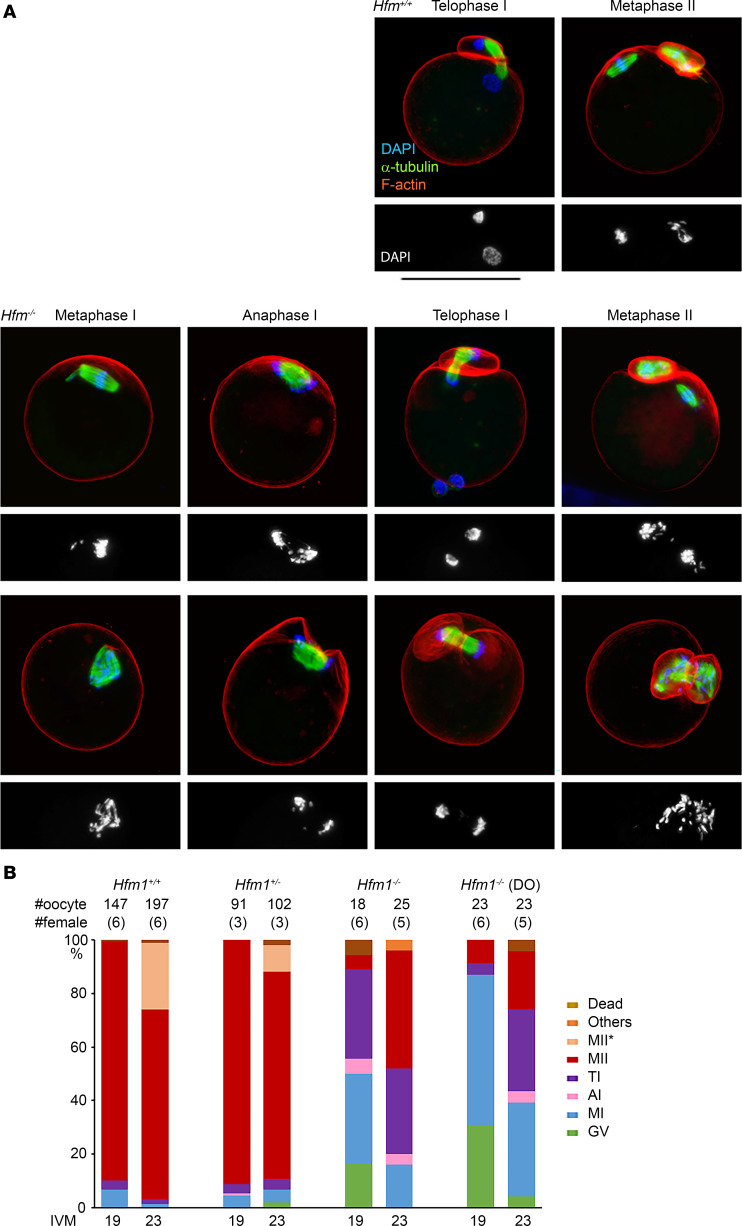
Figure 7. In vitro meiotic progression of oocytes from Hfm1+/+ and Hfm1–/– females.
(A) Confocal microscopy images after culture for 19–23 hours. DAPI staining alone is shown beneath each merged image. Hfm1+/+, representative images of the majority of oocytes; Hfm1–/– top, images observed that are closest to those from Hfm1+/+ females; Hfm1–/– bottom, examples of anomalies that were rarely seen in the oocytes from Hfm1+/+ females. Scale bar: 100 μm. (B) Percentage of oocytes in each meiotic stage. DO, spontaneously denuded oocytes before culture. MII* indicates that the spindle resembles MII but no polar body or chromosomes are seen outside the oocyte.

