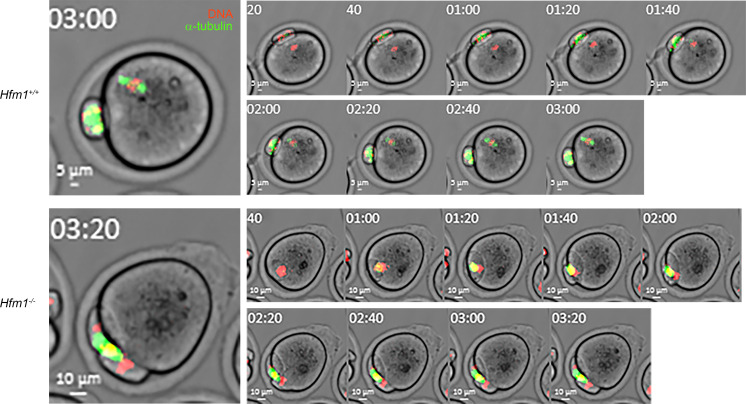
Figure 8. Live imaging of meiotic progression in the oocytes from Hfm1+/+ and Hfm1–/– females.
Staining of DNA (red) and α-tubulin (green) with phase contrast. Left: The oocytes at the end of imaging at a higher magnification. Time-lapse imaging started after 19 hours of IVM. (See also Supplemental Videos 1 and 2.)

