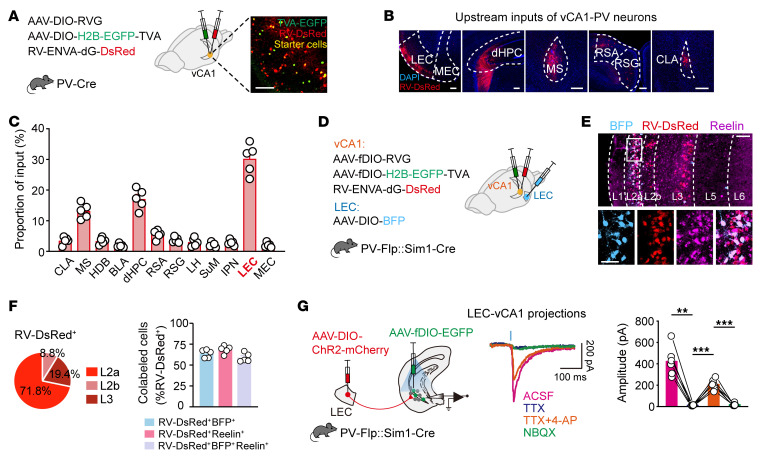
Figure 3. vCA1 PV-INs receive strong excitatory inputs from Sim1+ fan cells in LEC layer 2a.
(A) Schematic of AAV injections and experimental design (left) and a representative image of TVA-EGFP and RV-DsRed expression (right). Scale bar: 100 μm. (B) Representative images of the main upstream inputs. Scale bars: 200 μm. (C) Distribution of RV-DsRed–labeled neurons. n = 5 mice. CLA, claustrum; MS, medial septal nucleus; HDB, nucleus of the horizontal limb of the diagonal band; BLA, basolateral amygdalar nucleus; dHPC, dorsal hippocampus; RSA, retrosplenial agranular cortex; RSG, retrosplenial granular cortex; LH, lateral hypothalamic; SuM, supramammillary nucleus; IPN, interpeduncular nucleus; LEC, lateral entorhinal cortex; MEC, medial entorhinal cortex. (D–F) LEC layer 2a–vCA1 PV-IN projectors are Sim1+ fan cells. (D) Schematic of AAV injections. (E) Representative images of BFP+ (blue), RV-DsRed+ (red), and Reelin+ (purple) immunofluorescence in LEC. Scale bars: 100 μm (top), 50 μm (bottom). (F) LEC neurons projecting to vCA1 PV-INs are mainly located in layer 2a (left) and are characterized by the expression of Reelin (right). n = 5. (G) Patch clamp recordings of activity of vCA1 PV-INs in brain slices upon optogenetic stimulation of LEC layer 2a–vCA1 projection (left), showing example traces evoked by blue lights in the presence of ACSF, TTX (1 μM), TTX plus 4-AP (100 μM), and NBQX (10 μM). The blue vertical bar above traces indicates photostimulation. n = 6 neurons. **P < 0.01, ***P < 0.001, repeated-measures 1-way ANOVA with Tukey’s multiple-comparison test.

