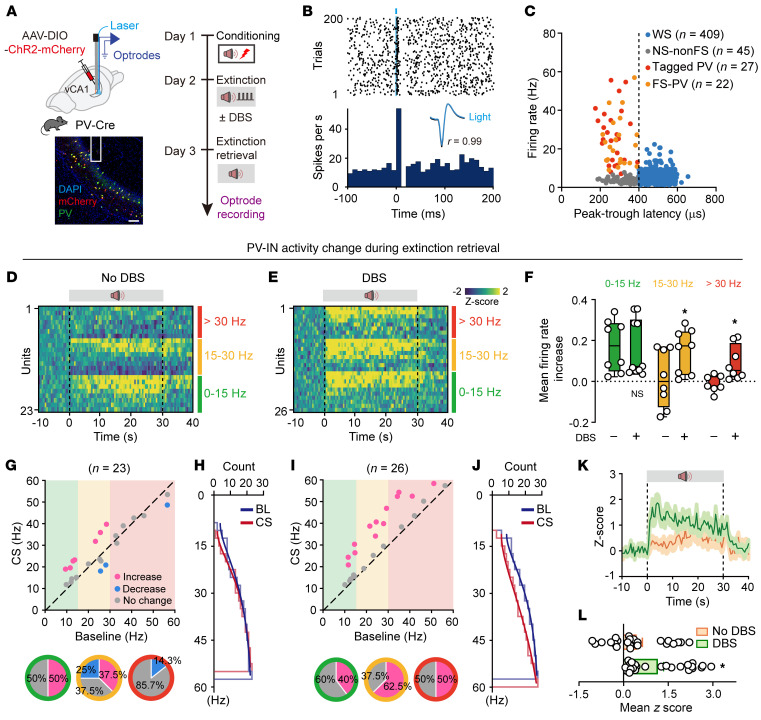
Figure 6. Extinction training paired with low-gamma DBS induces sustained activation of high-firing-rate vCA1 PV-INs during extinction retrieval.
(A) Schematics of experimental design (top) and representative image of virus expression (bottom). Scale bar: 100 μm. (B) Raster plot (top) and peri-stimulus time histogram (bottom) of representative tagged PV-INs. In the inset, light-evoked spike waveforms (blue) were similar to spontaneous ones (black). Pearson’s correlation, r = 0.99. (C) Classification of recorded vCA1 neurons into wide spike (WS) putative pyramidal cells (blue circles), narrow spike–non-fast-spiking (NS-nonFS) (gray circles), tagged PV (red circles), and FS-PV (orange circles) based on peak-to-trough latency and baseline firing rate. (D and E) Heatmaps showing responses of PV-INs with different baseline firing rates during extinction retrieval. (F) Box plots of firing rate changes. The center line shows median, box edges indicate top and bottom quartiles, and whiskers extend to minimum and maximum values. Circles denote individual neurons. *P < 0.05. (G and H) Correlation of firing rate at baseline and during CS for individual PV-INs from no-DBS-manipulation mice. (I and J) The same as G and H for the correlation of firing rate during baseline (BL) and CS for individual PV-INs from DBS-manipulation mice. (K and L) Z-scored signal changes of PV-INs during extinction retrieval. Orange indicates no DBS manipulation during extinction training, and green indicates 40 Hz DBS manipulation during extinction training. Data are mean ± SEM. *P < 0.05. Unpaired Student’s t test (F and L).

