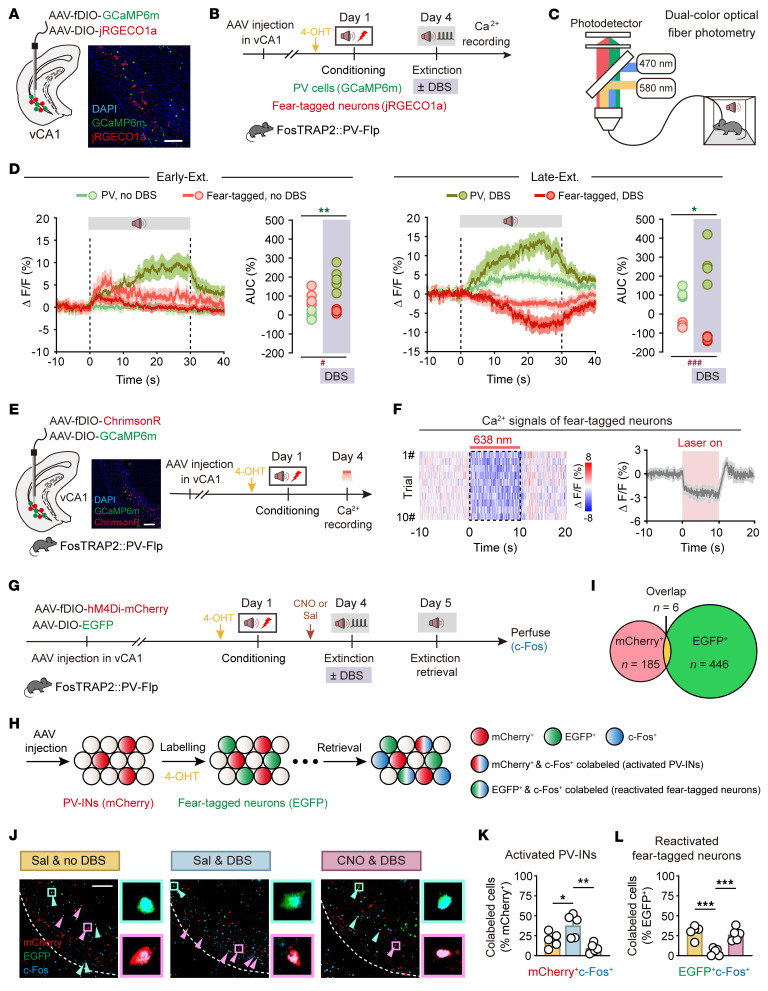
Figure 7. Extinction training paired with low-gamma DBS engages vCA1 PV-INs to suppress fear-tagged neurons.
(A) Schematic of AAV injections and representative image of virus expression. Scale bar: 100 μm. (B and C) Schematics of experimental design. (D) Average calcium signals in PV-INs and fear-tagged neurons during Early-Ext. (left) and Late-Ext (right). *P < 0.05, **P < 0.01, PV-INs DBS vs. PV-INs no DBS, unpaired Student’s t test; #P < 0.05, ###P < 0.001, fear-tagged neurons, DBS vs. no DBS. n = 5 mice per group. (E) Schematics of AAV injections and experimental design. Representative images of GCaMP6m expression in fear-tagged neurons and ChrimsonR expression in PV-INs in vCA1. Scale bar: 100 μm. (F) Left: Representative heatmap of fiber photometry recordings. Right: Averaged fluorescence decreased in response to optogenetic stimulation (n = 5 mice). (G) Schematic of AAV injections and experimental design. Administration of 4-OHT, 30 minutes before fear conditioning (i.p.), to FosTRAP2 PV-Flp mice was used to induce permanent expression of EGFP in neurons active around the time of the injection. (H) Genetic design to investigate fear-tagged neurons and neurons activated during extinction retrieval. Red circles represent PV-INs, green circles represent neurons labeled during conditioning, and blue circles represent neurons activated during memory retrieval. (I) Overlap between vCA1 PV-INs (mCherry+) and fear-tagged neurons (EGFP+). (J) Representative images of mCherry+ (red), EGFP+ (green), and c-Fos+ (blue) immunofluorescence in vCA1. Magenta arrowheads denote colabeled mCherry+c-Fos+ cells; cyan arrowheads denote colabeled EGFP+c-Fos+ cells. Circles represent enlarged images on the right. Scale bar: 100 μm. (K and L) The percentage of activated PV-INs (mCherry+c-Fos+) and reactivated fear-tagged neurons (EGFP+c-Fos+). Data are mean ± SEM. *P < 0.05, **P < 0.01, ***P < 0.001. Unpaired Student’s t test (D) and 1-way ANOVA with Tukey’s multiple-comparison test (K and L).

