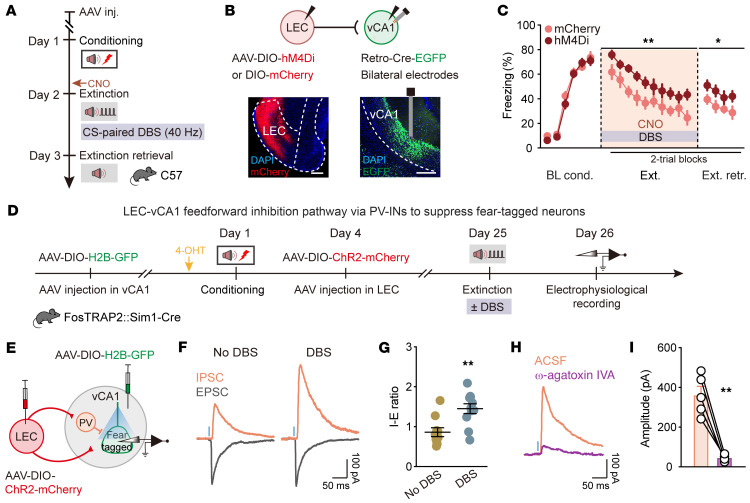
Figure 8. Low-gamma DBS strengthens the inputs from LEC driving PV IN–mediated feedforward inhibition in vCA1 and induces long-lasting suppression of fear-tagged neurons.
(A) Schematic of experimental design. CS is paired with 40 Hz DBS during extinction training, and CNO was administered (i.p.) 30 minutes before extinction training. (B) Schematic of AAV injections (top) and representative images of virus expression (bottom). Scale bars: 200 μm. (C) Effect of inhibiting LEC-vCA1 projectors on DBS-induced extinction promotion. Time courses of freezing responses to the CS during fear conditioning, extinction training, and extinction retrieval sessions. Statistics are as follows: Main effect of AAV, conditioning, F1,21 = 0.4901, P = 0.4916; extinction training, F1,21 = 8.408, P = 0.0086; extinction retrieval, F1,21 = 7.556, P = 0.0120. mCherry group, n = 12 mice; hM4Di group, n = 11 mice. Data are mean ± SEM. *P < 0.05, **P < 0.01. (D) Schematic of AAV injections and experimental design. 4-OHT was administered 30 minutes before fear conditioning. (E) Experimental scheme for simultaneous recording of light-evoked EPSCs and IPSCs on vCA1 fear-tagged neurons. (F) Representative traces of EPSCs and IPSCs evoked by optogenetic stimulation of LEC fibers. (G) IPSC/EPSC peak ratios (No DBS, n = 10 cells; DBS, n = 11 cells). Data are mean ± SEM. **P < 0.01. (H) Representative traces showing that light-evoked IPSC amplitudes were reduced with application of 0.5 μM ω-agatoxin IVA. (I) Light-evoked IPSC amplitudes in vCA1 fear-tagged neurons with and without ω-agatoxin IVA (n = 5 cells). Data are mean ± SEM. **P < 0.01. Repeated-measures 2-way ANOVA (C), unpaired Student’s t test (G), and paired Student’s t test (I).

