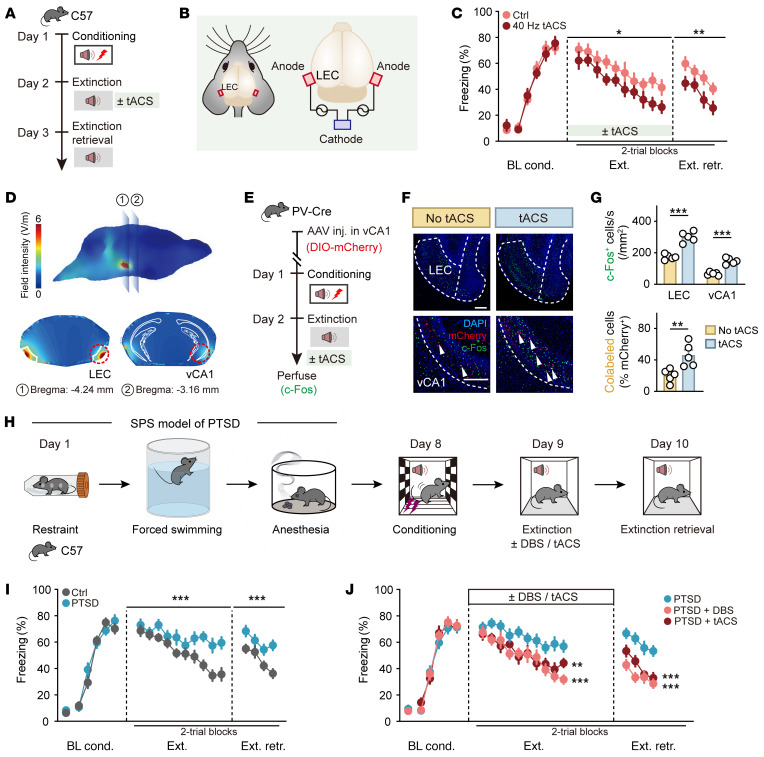
Figure 9. Low-gamma stimulation of LEC vCA1 circuit enhances fear extinction, even under more traumatic conditions.
(A and E) Schematics of experimental design. (B) Schematic diagram of stimulus configuration. (C) Time courses of freezing responses to the CS. Statistics are as follows: Main effect of tACS, conditioning, F1,14 = 0.0331, P = 0.8582; extinction training, F1,14 = 8.055, P = 0.0132; extinction retrieval, F1,14 = 15.87, P = 0.0014. n = 8 mice per group. (D) Predicted current density map at the surface of the brain during tACS (top) and slice images of the distribution showing peak current densities during tACS (bottom). (F) Representative images of mCherry+ (red) and c-Fos+ (green) immunofluorescence. White arrowheads denote colabeled cells. Scale bars: 200 μm. (G) Quantification for F. n = 5 mice per group. (H) Schematic illustration of single prolonged stress (SPS) and the fear conditioning paradigm. (I and J) Time courses of freezing responses to the CS. Statistics are as follows: (I) Main effect of treatment, conditioning, F1,16 = 0.2782, P = 0.6051; extinction training, F1,16 = 22.92, P = 0.0002; extinction retrieval, F1,16 = 38.08, P < 0.0001. n = 9 mice per group. (J) PTSD vs. PTSD + DBS, conditioning, F1,16 = 0.5860, P = 0.4551; extinction training, F1,16 = 16.79, P = 0.0008; extinction retrieval, F1,16 = 70.31, P < 0.0001. PTSD vs. PTSD + tACS, conditioning, F1,15 = 0.5624, P = 0.4649; extinction training, F1,15 = 14.42, P = 0.0018; extinction retrieval, F1,15 = 30.04, P < 0.0001. PTSD group, n = 9 mice; PTSD + DBS group, n = 9 mice; PTSD + tACS group, n = 8 mice. Data are mean ± SEM. *P < 0.05, **P < 0.01, ***P < 0.001. Repeated-measures 2-way ANOVA (C, I, and J) and unpaired Student’s t test (G).

