. 2024 Aug 17;83(12):e225868. doi: 10.1136/ard-2024-225868

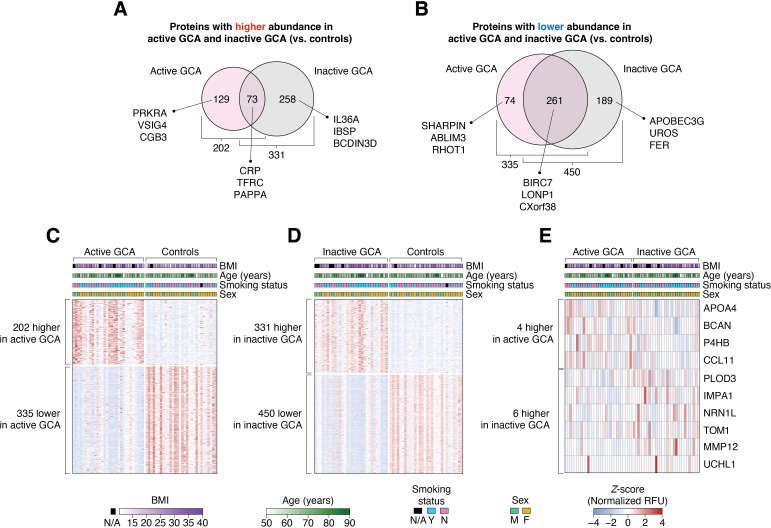
Figure 2. Differentially abundant plasma proteins between study groups. (A, B) Of the 7289 measured plasma proteins, 984 showed differential abundance between GCA groups (ie, active or inactive GCA) and controls. In active GCA, the abundance of 202 and 335 proteins were higher and lower compared with controls, respectively. Conversely, in inactive GCA, the abundance of 331 and 450 proteins were higher and lower than in controls, respectively. Heatmaps showing the Z-score-normalised relative fluorescence unit (RFU) abundances of differentially abundant proteins between (C) active GCA and controls (537 proteins); (D) inactive GCA and controls (781 proteins) and (E) active and inactive GCA (10 proteins). In each heatmap, the columns represent study participants while the rows correspond to proteins. Demographic variables (BMI, age, smoking status, and sex) of each study subject are shown at the top of each heatmap. BMI, body mass index; GCA, giant cell arteritis.

Figure 2