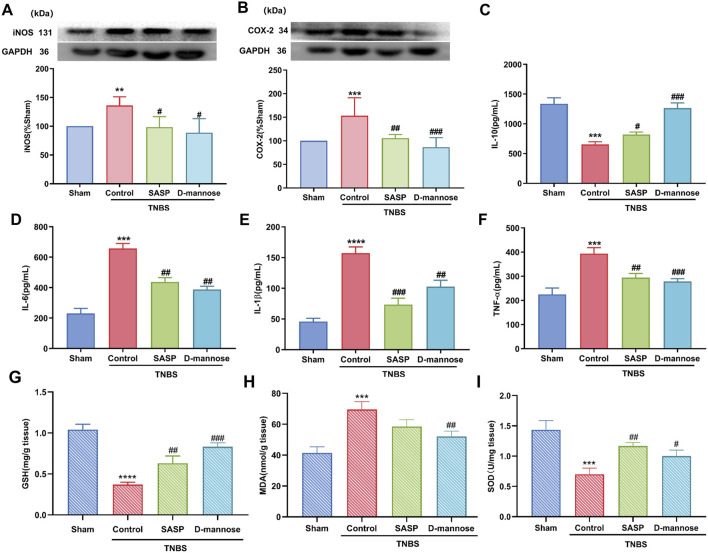
FIGURE 3.
Effect of D-mannose on inflammatory factors and oxidative stress. Western blotting analysis of the secretion of inflammation-related proteins: (A) iNOS; (B) COX-2; ELISA analysis of inflammatory cytokines; (C) IL-10; (D) IL-6; (E) IL-1β; (F) TNF-α; Oxidative stress index analysis; (G) GSH; (H) MDA; (I) SOD. Data were expressed as mean ± SD. **p < 0.01 compared with sham group. ***p < 0.001 compared with sham group; ****p < 0.0001 compared with sham group; #p < 0.05 compared with TNBS model control group. ##p < 0.01 compared with TNBS model control group. ###p < 0.001 compared with TNBS model control group. n = 10 mice.

