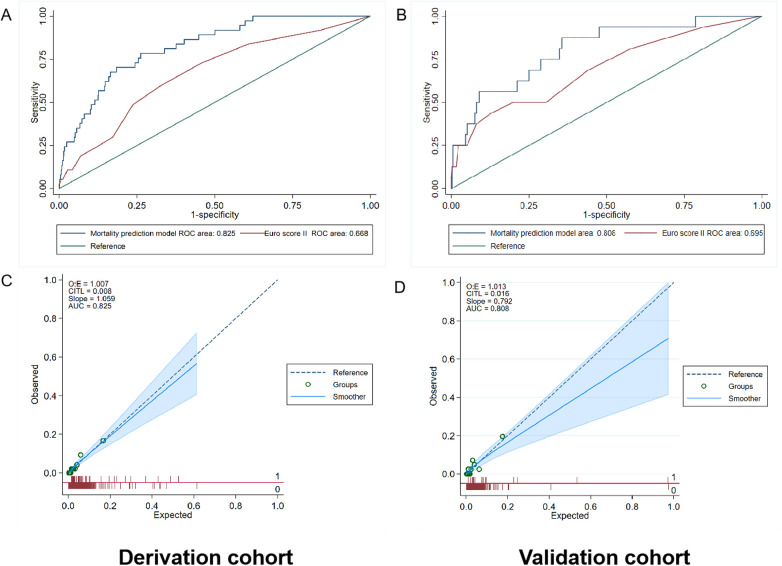
Figure 4.
Performance evaluation in terms of mortality prediction model in the derivation and validation cohorts. (A) The area under the receiver operating characteristic curve (AUC) of the mortality prediction model in the derivation cohort was 0.825 [95% confidence interval (CI): 0.764–0.886], which was better than that of Euro score II (p < 0.001). (B) The AUC of the mortality prediction model in the external validation cohort was 0.808 (95% CI: 0.699–0.917), which was also better than that of Euro score II (p < 0.001). (C,D) Calibration plot of the mortality prediction model in the derivation and validation cohort. The dashed diagonal line represents perfect calibration. The x-axis is the predicted probability estimated by the model and the y-axis is the actual probability.

