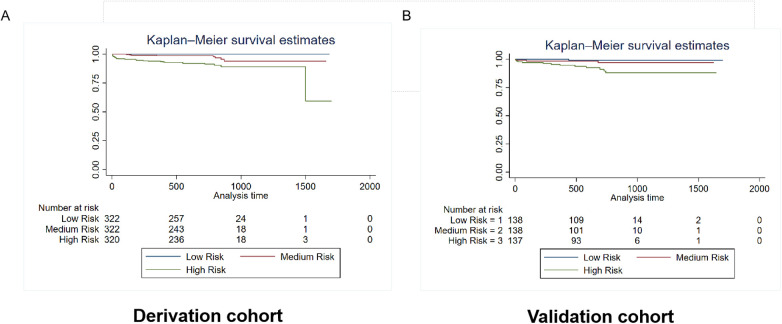
Figure 6.
Kaplan–Meier estimates of mortality in the derivation and validation cohorts. The survival rate was observed using the Kaplan–Meier curves and compared using the log-rank test. (A) Kaplan–Meier estimates of the survival rate in the derivation cohort using the mortality prediction model (p < 0.0001). (B) Kaplan–Meier estimates of the survival rate in the external validation cohort using the mortality prediction model.As shown by the Kaplan–Meier curves, the two cohorts showed significant differences in mortality among the three risk-score groups (p < 0.0001).

