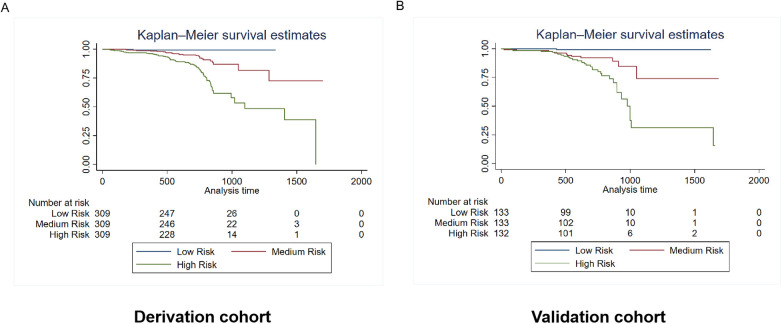
Figure 7.
Kaplan–Meier estimates of rehospitalization for heart failure in the derivation and validation cohorts. The survival rate was observed using the Kaplan–Meier curves and compared using the log-rank test. (A) Kaplan–Meier estimates of rehospitalization for heart failure in the derivation cohort using the rehospitalization prediction model (p < 0.0001). (B) Kaplan–Meier estimates of rehospitalization for heart failure in the validation cohort using the rehospitalization prediction model (p < 0.0001). As shown by the Kaplan–Meier curves, the two cohorts showed significant differences in rehospitalization for heart failure among the three risk-score groups (p < 0.0001).

