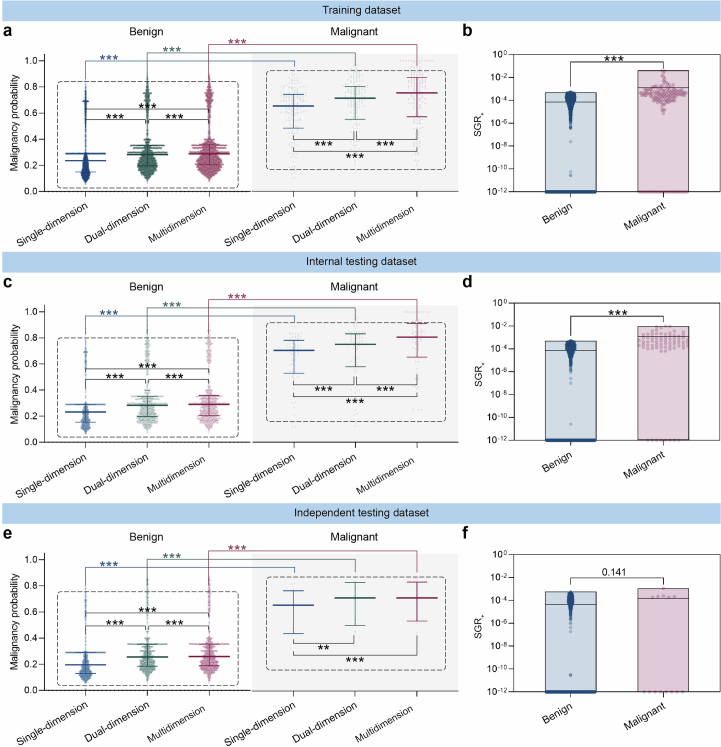
Extended Data Fig. 7. The malignancy probability and SGR+ distribution of the benign and malignant nodules in the three datasets predicted with single-, dual-, and multidimensional features.
The distribution of the benign and malignant nodules in the training dataset (a, b); internal testing dataset (c, d); independent testing dataset (e, f). The malignancy probability predicted by three models are visualized in scatter plots (a, c, e) with distribution (median with interquartile range). Statistical analyses in (a, c, e) were performed using Mann-Whitney U tests to compare the benign and the malignant for the same model, and using Friedman tests followed by Dunnett’s multiple comparison tests to compare the single-, dual-, and multidimension models. Asterisks represent two-tailed adjusted P value, with ** indicating P < 0.01 and *** indicating P < 0.001. The P values in (e) for malignancy probabilities of the malignant in single-dimension vs. dual-dimension and dual-dimension vs. multidimension were 0.002 and 0.771, respectively. SGR+ distributions are plotted as floating bars with min to max (b, d, f), where the line is the mean. Statistical analyses in (b, d, f) were performed using Mann-Whitney U tests to compare the SGR+ of the benign and the malignant used in the multidimension model. Asterisks represent two-tailed P value, with *** indicating P < 0.001. The P value in (f) was 0.141.

