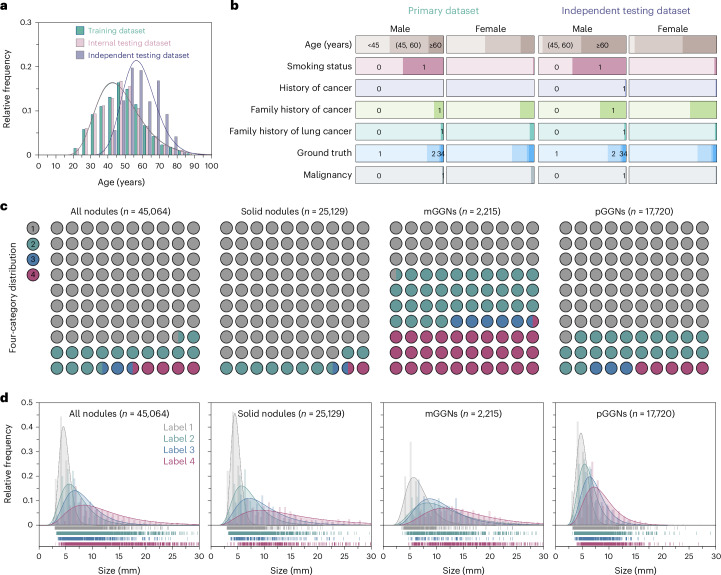
Fig. 2. Characteristics of the participants and nodules.
a, The age distribution and corresponding Gaussian fitted curves in different datasets. b, The distribution of demographic characteristics. For smoking status, history of cancer, family history of cancer, family history of lung cancer and malignancy, 0 represents no and 1 represents yes. c, The distribution of nodules with different risk levels in the primary dataset. d, Histograms of nodule size distribution and corresponding Gaussian fitted curves in the primary dataset.

